
Broadridge Financial Solutions Inc. (BR): Price and Financial Metrics
BR Price/Volume Stats
| Current price | $212.63 | 52-week high | $213.24 |
| Prev. close | $208.07 | 52-week low | $164.99 |
| Day low | $208.00 | Volume | 343,817 |
| Day high | $213.24 | Avg. volume | 504,806 |
| 50-day MA | $200.98 | Dividend yield | 1.56% |
| 200-day MA | $196.12 | Market Cap | 25.13B |
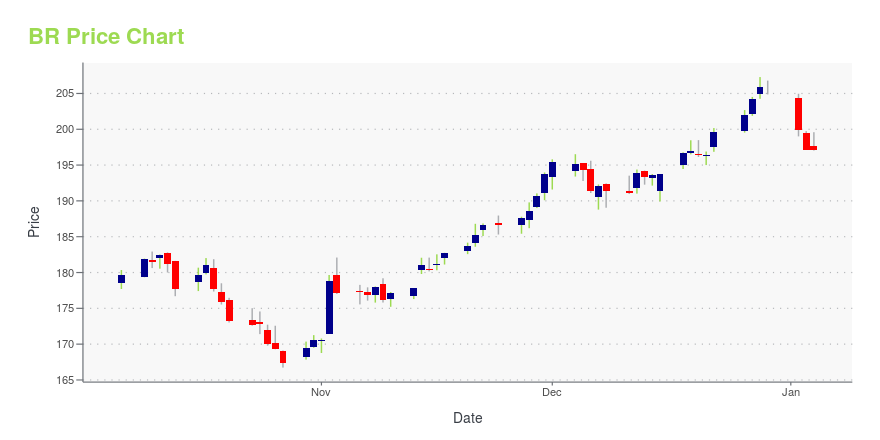
BR Stock Price Chart Interactive Chart >
Broadridge Financial Solutions Inc. (BR) Company Bio
Broadridge Financial Solutions is a public corporate services and financial technology company founded in 2007 as a spin-off from management software company Automatic Data Processing. Broadridge supplies public companies with proxy statements, annual reports and other financial documents, and shareholder communications solutions, such as virtual annual meetings. (Source:Wikipedia)
Latest BR News From Around the Web
Below are the latest news stories about BROADRIDGE FINANCIAL SOLUTIONS INC that investors may wish to consider to help them evaluate BR as an investment opportunity.
Reasons Why You Should Retain ABM Industries (ABM) Stock NowStrategic partnerships and the execution of the plan called ELEVATE are boding well for ABM Industries (ABM). |
Reasons Why You Should Hold on to Stericycle (SRCL) NowStericycle (SRCL) is gaining from its transformation initiative launched in 2017 and its robust acquisition strategy. |
Why This 1 Business Services Stock Could Be a Great Addition to Your PortfolioFinding strong, market-beating stocks with a positive earnings outlook becomes easier with the Focus List, a top feature of the Zacks Premium portfolio service. |
Broadridge Financial Solutions Inc Insider Sells Company SharesChristopher Perry, President of Broadridge Financial Solutions Inc (NYSE:BR), executed a sale of 9,365 shares in the company on December 26, 2023, according to a recent SEC Filing. |
Broadridge Financial Solutions (NYSE:BR) Could Be Struggling To Allocate CapitalTo find a multi-bagger stock, what are the underlying trends we should look for in a business? Typically, we'll want to... |
BR Price Returns
| 1-mo | 6.09% |
| 3-mo | 9.97% |
| 6-mo | 3.11% |
| 1-year | 27.29% |
| 3-year | 30.33% |
| 5-year | 72.55% |
| YTD | 4.18% |
| 2023 | 56.23% |
| 2022 | -25.26% |
| 2021 | 21.12% |
| 2020 | 26.28% |
| 2019 | 30.59% |
BR Dividends
| Ex-Dividend Date | Type | Payout Amount | Change | ||||||
|---|---|---|---|---|---|---|---|---|---|
| Loading, please wait... | |||||||||
Continue Researching BR
Want to see what other sources are saying about Broadridge Financial Solutions Inc's financials and stock price? Try the links below:Broadridge Financial Solutions Inc (BR) Stock Price | Nasdaq
Broadridge Financial Solutions Inc (BR) Stock Quote, History and News - Yahoo Finance
Broadridge Financial Solutions Inc (BR) Stock Price and Basic Information | MarketWatch
Loading social stream, please wait...