
Brera Holdings PLC (BREA): Price and Financial Metrics
BREA Price/Volume Stats
| Current price | $7.61 | 52-week high | $19.50 |
| Prev. close | $7.69 | 52-week low | $5.00 |
| Day low | $7.48 | Volume | 12,500 |
| Day high | $7.62 | Avg. volume | 79,842 |
| 50-day MA | $6.99 | Dividend yield | N/A |
| 200-day MA | $7.27 | Market Cap | 9.69M |
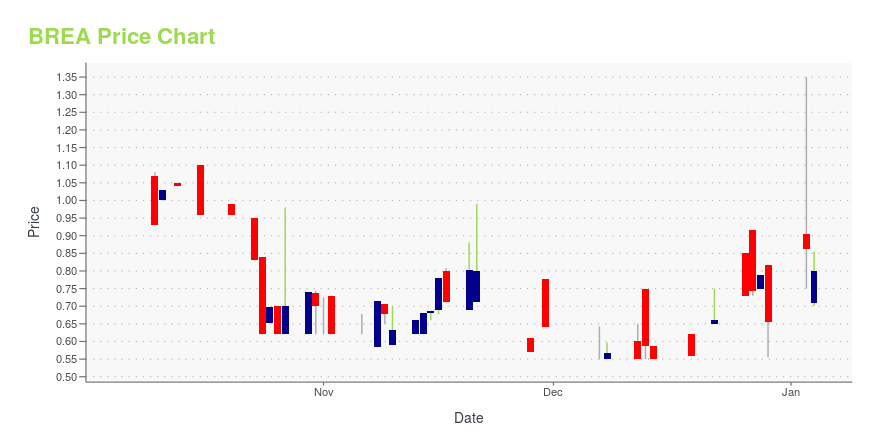
BREA Stock Price Chart Interactive Chart >
BREA Price Returns
| 1-mo | 4.98% |
| 3-mo | 7.20% |
| 6-mo | -11.23% |
| 1-year | -7.18% |
| 3-year | N/A |
| 5-year | N/A |
| YTD | -7.53% |
| 2024 | 25.53% |
| 2023 | N/A |
| 2022 | N/A |
| 2021 | N/A |
| 2020 | N/A |
Loading social stream, please wait...