Brown & Brown Inc. (BRO): Price and Financial Metrics

Brown & Brown Inc. (BRO): $62.87

-0.22 (-0.35%)

POWR Rating

Component Grades

Growth

S

Value

I

Momentum

G

Stability

N

Sentiment

U

Quality

P

BRO Price/Volume Stats

Current price $62.87 52-week high $68.43
Prev. close $63.09 52-week low $52.82
Day low $62.75 Volume 986,300
Day high $63.60 Avg. volume 1,237,809
50-day MA $61.14 Dividend yield 0.73%
200-day MA $59.93 Market Cap 17.83B

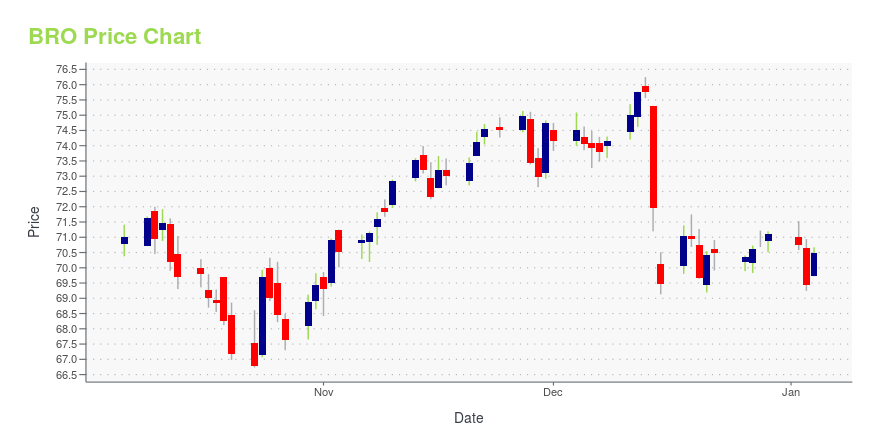
BRO Stock Price Chart Interactive Chart >

BRO POWR Grades

  • BRO scores best on the Momentum dimension, with a Momentum rank ahead of 87.05% of US stocks.
  • BRO's strongest trending metric is Sentiment; it's been moving up over the last 179 days.
  • BRO ranks lowest in Value; there it ranks in the 3rd percentile.

BRO Stock Summary

  • BRO has a market capitalization of $17,895,116,616 -- more than approximately 89.3% of US stocks.
  • BRO's went public 31.25 years ago, making it older than 83.73% of listed US stocks we're tracking.
  • In terms of volatility of its share price, BRO is more volatile than merely 6.02% of stocks we're observing.
  • Stocks that are quantitatively similar to BRO, based on their financial statements, market capitalization, and price volatility, are IEX, SJM, HUBB, DGX, and J.
  • Visit BRO's SEC page to see the company's official filings. To visit the company's web site, go to www.bbinsurance.com.

BRO Valuation Summary

  • BRO's EV/EBIT ratio is 20.8; this is 92.59% higher than that of the median Financial Services stock.
  • Over the past 243 months, BRO's price/earnings ratio has gone up 2.

Below are key valuation metrics over time for BRO.

Stock Date P/S P/B P/E EV/EBIT
BRO 2023-05-19 5.0 3.9 27.4 20.8
BRO 2023-05-18 5.0 3.9 27.4 20.8
BRO 2023-05-17 4.9 3.8 27.0 20.6
BRO 2023-05-16 4.9 3.8 27.1 20.6
BRO 2023-05-15 4.9 3.9 27.2 20.7
BRO 2023-05-12 4.9 3.8 27.1 20.6

BRO Growth Metrics

    The year over year net cashflow from operations growth rate now stands at 13.29%.
  • Its 5 year net income to common stockholders growth rate is now at 64.58%.
  • The 3 year net income to common stockholders growth rate now stands at 65.43%.
BRO's revenue has moved up $551,764,000 over the prior 15 months.

The table below shows BRO's growth in key financial areas (numbers in millions of US dollars).

Date Revenue Operating Cash Flow Net Income to Common Stock
2022-09-30 3,410.465 914.426 628.317
2022-06-30 3,253.17 822.402 613.571
2022-03-31 3,140.822 920.961 607.661
2021-12-31 3,051.398 942.469 587.104
2021-09-30 2,955.044 809.902 582.708
2021-06-30 2,858.701 771.215 570.333

BRO's Quality Factors

The “Quality” component of the POWR Ratings focuses on 31 different factors of a companies fundamentals and operational strength. Here are some key insights as we drill into the specifics of these quality attributes.
  • BRO has a Quality Grade of B, ranking ahead of 88.29% of graded US stocks.
  • BRO's asset turnover comes in at 0.321 -- ranking 52nd of 133 Insurance stocks.
  • ERIE, TRV, and UNH are the stocks whose asset turnover ratios are most correlated with BRO.

The table below shows BRO's key quality metrics over time.

Period Asset Turnover Gross Margin ROIC
2021-09-30 0.321 1 0.399
2021-06-30 0.317 1 0.365
2021-03-31 0.313 1 0.345
2020-12-31 0.312 1 0.345
2020-09-30 0.317 1 0.352
2020-06-30 0.321 1 0.373

BRO Price Target

For more insight on analysts targets of BRO, see our BRO price target page. And for a list of of all stocks sorted by upside potential based on analyst target price, see our Top Price Target page.

Average Price Target $59.17 Average Broker Recommendation 1.83 (Hold)

Brown & Brown Inc. (BRO) Company Bio


Brown & Brown, Inc. (Brown & Brown Insurance) is a leading insurance brokerage firm, delivering risk management solutions to individuals and businesses since 1939. Headquartered in Daytona Beach, Florida, Brown & Brown has 450+ locations worldwide. (Source:Wikipedia)


BRO Latest News Stream


Event/Time News Detail
Loading, please wait...

BRO Latest Social Stream


Loading social stream, please wait...

View Full BRO Social Stream

Latest BRO News From Around the Web

Below are the latest news stories about BROWN & BROWN INC that investors may wish to consider to help them evaluate BRO as an investment opportunity.

Brown & Brown, Inc. enters into agreement to acquire Kentro Capital Limited d/b/a Nexus Underwriting and Xenia Broking

DAYTONA BEACH, Fla., May 22, 2023 (GLOBE NEWSWIRE) -- J. Scott Penny, chief acquisitions officer of Brown & Brown, Inc. (NYSE:BRO), today announced that Brown & Brown has entered into an agreement to acquire Kentro Capital Limited (“Kentro”). The transaction is expected to close in the fourth quarter of 2023, subject to certain closing conditions, including the receipt of required regulatory approvals. Kentro is an insurance industry group headquartered in London, managing over £500 million of g

Yahoo | May 22, 2023

Arthur J. Gallagher (AJG) on a Buyout Spree, Boosts Portfolio

Arthur J. Gallagher's (AJG) buyouts help it solidify geographical presence as well as consolidate portfolio.

Yahoo | May 17, 2023

Brown & Brown (BRO) Acquires Brownlee Agency, Boosts Portfolio

Brown & Brown's (BRO) buyout of Brownlee Agency is likely to strengthen the insurance broker's capabilities and expand its presence in Georgia.

Yahoo | May 9, 2023

Brown & Brown, Inc. announces the asset acquisition of Brownlee Agency, Inc.

DAYTONA BEACH, Fla., May 08, 2023 (GLOBE NEWSWIRE) -- J. Scott Penny, chief acquisitions officer of Brown & Brown, Inc. (NYSE:BRO), and Casey C. Brownlee, John R. Brownlee and David Z. Monk, the shareholders of Brownlee Agency, Inc., today announced that a subsidiary of Brown & Brown, Inc., has acquired substantially all of the assets of Brownlee Agency. Founded in 1974, Brownlee Agency offers a wide variety of property and casualty insurance products and services to customers throughout Georgia

Yahoo | May 8, 2023

Why Brown & Brown Stock Jumped 12% in April

Brown & Brown (NYSE: BRO) saw its stock price jump 12.1% in April, according to S&P Global Market Intelligence. As of May 4, Brown & Brown was trading at about $64 per share, up roughly 12.5% year to date (YTD). The stock outperformed the major market indexes, as the S&P 500 was up 1.5%, the Dow Jones Industrial Average climbed 2.5%, and the Nasdaq Composite was essentially flat in April.

Yahoo | May 4, 2023

Read More 'BRO' Stories Here

BRO Price Returns

1-mo -2.19%
3-mo 12.45%
6-mo 7.11%
1-year N/A
3-year 59.82%
5-year 135.83%
YTD 10.77%
2022 -18.39%
2021 49.31%
2020 21.06%
2019 44.67%
2018 8.30%

BRO Dividends

Ex-Dividend Date Type Payout Amount Change
Loading, please wait...
View Full BRO Dividend History

Continue Researching BRO

Here are a few links from around the web to help you further your research on Brown & Brown Inc's stock as an investment opportunity:

Brown & Brown Inc (BRO) Stock Price | Nasdaq
Brown & Brown Inc (BRO) Stock Quote, History and News - Yahoo Finance
Brown & Brown Inc (BRO) Stock Price and Basic Information | MarketWatch

Get Free Updates

Join thousands of investors who get the latest news, insights and top rated picks from StockNews.com!


Page generated in 0.6603 seconds.