
Dutch Bros Inc. (BROS): Price and Financial Metrics
BROS Price/Volume Stats
| Current price | $38.02 | 52-week high | $43.49 |
| Prev. close | $37.16 | 52-week low | $22.67 |
| Day low | $37.41 | Volume | 2,335,292 |
| Day high | $38.80 | Avg. volume | 2,496,426 |
| 50-day MA | $38.80 | Dividend yield | N/A |
| 200-day MA | $31.51 | Market Cap | 6.74B |
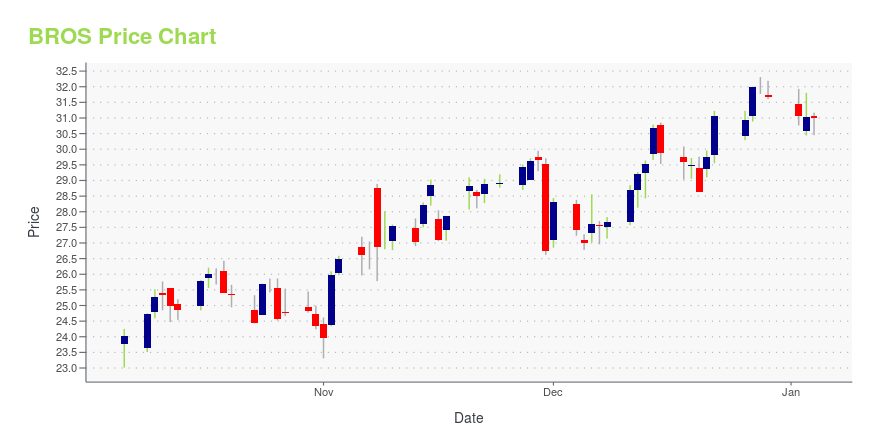
BROS Stock Price Chart Interactive Chart >
Dutch Bros Inc. (BROS) Company Bio
Dutch Bros Inc. operates and franchises drive-thru shops. The company offers Dutch Bros hot and cold espresso-based beverages, and cold brew coffee products, as well as Blue Rebel energy drinks, tea, lemonade, smoothies, and other beverages through company-operated shops and online channels. It operates approximately 470 drive-thru coffee locations in 11 states. The company was founded in 1992 and is headquartered in Grants Pass, Oregon.
Latest BROS News From Around the Web
Below are the latest news stories about DUTCH BROS INC that investors may wish to consider to help them evaluate BROS as an investment opportunity.
Why Dutch Bros Stock Could Explode Higher in 2024New management and easing inflation could lead to big stock gains. |
Should You Buy Dutch Bros Stock Hand Over Fist With $1,000?At first glance, it seems like a no-brainer buy, but the coffee seller's business plan faces some notable risks. |
2 Stocks Under $100 You Can Buy and Hold ForeverThese companies have bright futures and don't take a ton of cash to buy. |
Dutch Bros Stock Beat Starbucks in 2023. Is It a Buy Now?The smaller coffee specialist is doubling down on its expansion plan. |
Should Starbucks (NASDAQ:SBUX) Worry as CosMc’s Enters the Market?McDonald’s (NYSE:MCD) and Starbucks (NASDAQ:SBUX) are two of the largest quick-service restaurant firms on the planet. Though they’ve specialized in different corners of the fast-food scene, with McDonald’s specializing in burgers and fries and Starbucks catering to the morning crowd looking to get their coffee and treat fix (who can resist those sous-vide egg bites and ready-to-go snack boxes?), one can’t help but notice increasing overlap between the two fast-food juggernauts. Undoubtedly, McD |
BROS Price Returns
| 1-mo | -8.30% |
| 3-mo | 32.98% |
| 6-mo | 38.25% |
| 1-year | 31.19% |
| 3-year | N/A |
| 5-year | N/A |
| YTD | 20.05% |
| 2023 | 12.34% |
| 2022 | -44.63% |
| 2021 | N/A |
| 2020 | N/A |
| 2019 | N/A |
Loading social stream, please wait...