BRP GROUP, INC. (BRP): Price and Financial Metrics
GET POWR RATINGS... FREE!
BRP POWR Grades
- Growth is the dimension where BRP ranks best; there it ranks ahead of 97.98% of US stocks.
- BRP's strongest trending metric is Value; it's been moving up over the last 177 days.
- BRP's current lowest rank is in the Quality metric (where it is better than 4.99% of US stocks).
BRP Stock Summary
- With a year-over-year growth in debt of 114.92%, BRP GROUP INC's debt growth rate surpasses 89.11% of about US stocks.
- Over the past twelve months, BRP has reported earnings growth of 604.64%, putting it ahead of 97.11% of US stocks in our set.
- As for revenue growth, note that BRP's revenue has grown 87.11% over the past 12 months; that beats the revenue growth of 90.26% of US companies in our set.
- If you're looking for stocks that are quantitatively similar to BRP GROUP INC, a group of peers worth examining would be NEOG, GPRE, CATO, INSP, and GLDD.
- Visit BRP's SEC page to see the company's official filings. To visit the company's web site, go to www.baldwinriskpartners.com.
BRP Valuation Summary
- In comparison to the median Financial Services stock, BRP's price/sales ratio is 207.69% higher, now standing at 4.
- Over the past 40 months, BRP's EV/EBIT ratio has gone up 3.5.
Below are key valuation metrics over time for BRP.
Stock | Date | P/S | P/B | P/E | EV/EBIT |
---|---|---|---|---|---|
BRP | 2023-02-03 | 4.0 | 5.5 | -225.8 | 124.8 |
BRP | 2023-02-02 | 3.9 | 5.4 | -220.9 | 122.8 |
BRP | 2023-02-01 | 3.9 | 5.3 | -216.5 | 120.9 |
BRP | 2023-01-31 | 3.7 | 5.1 | -208.4 | 117.6 |
BRP | 2023-01-30 | 3.6 | 5.0 | -203.2 | 115.4 |
BRP | 2023-01-27 | 3.7 | 5.1 | -206.4 | 116.7 |
BRP's Quality Factors
The “Quality” component of the POWR Ratings focuses on 31 different factors of a companies fundamentals and operational strength. Here are some key insights as we drill into the specifics of these quality attributes.- BRP has a Quality Grade of D, ranking ahead of 8.06% of graded US stocks.
- BRP's asset turnover comes in at 0 -- ranking 132nd of 133 Insurance stocks.
- 500 - Internal server error
The table below shows BRP's key quality metrics over time.
Period | Asset Turnover | Gross Margin | ROIC |
---|---|---|---|
2021-06-30 | 0 | NA | 0.030 |
2021-03-31 | 0 | NA | 0.041 |
2020-12-31 | 0 | NA | -0.044 |
2020-09-30 | 0 | NA | -0.144 |
2020-06-30 | 0 | NA | -0.084 |
2019-12-31 | 0 | NA | 0.035 |
BRP Price Target
For more insight on analysts targets of BRP, see our BRP price target page. And for a list of of all stocks sorted by upside potential based on analyst target price, see our Top Price Target page.
Average Price Target | $36.71 | Average Broker Recommendation | 1.61 (Moderate Buy) |
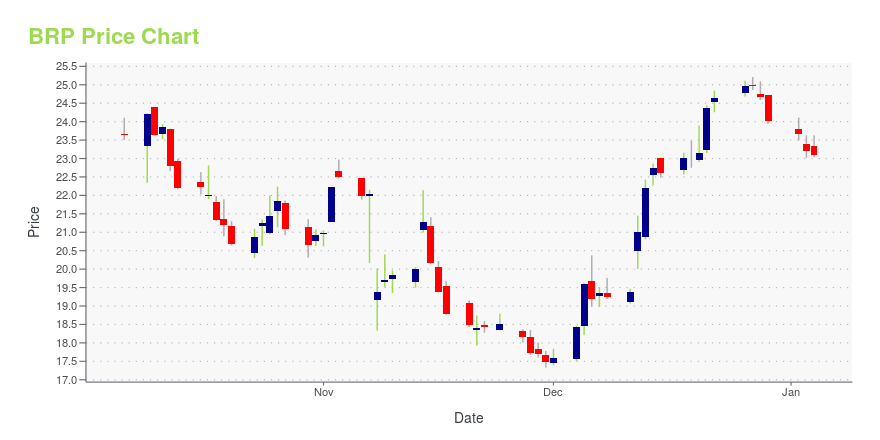
BRP Stock Price Chart Interactive Chart >
BRP Price/Volume Stats
Current price | $30.80 | 52-week high | $33.34 |
Prev. close | $31.05 | 52-week low | $17.08 |
Day low | $30.60 | Volume | 240,000 |
Day high | $31.37 | Avg. volume | 367,425 |
50-day MA | $28.38 | Dividend yield | N/A |
200-day MA | $27.23 | Market Cap | 3.57B |
BRP GROUP, INC. (BRP) Company Bio
BRP Group, Inc. provides insurance services. It operates through the following four segments: Middle Market, Specialty, Mainstreet, and Medicare. The Middle Market segment provides private risk management, commercial risk management and employee benefits solutions for mid-to-large size businesses and high net worth individuals and families. The Specialty segment is a wholesale co-brokerage platform, which delivers specialty insurers, professionals, individuals and niche industry businesses expanded access to exclusive specialty markets, capabilities and programs requiring complex underwriting and placement. The Mainstreet segment offers personal insurance, commercial insurance and life and health solutions to individuals and businesses in their communities. The Medicare segment offers consultation for government assistance programs and solutions, including traditional Medicare and Medicare Advantage
Latest BRP News From Around the Web
Below are the latest news stories about BRP GROUP INC that investors may wish to consider to help them evaluate BRP as an investment opportunity.
MFC or BRP: Which Is the Better Value Stock Right Now?MFC vs. BRP: Which Stock Is the Better Value Option? |
Millennial Specialty Insurance, LLC chooses Milliman Bungalow as its private flood insurance pricing solution to close the flood protection gapMilliman, Inc. ("Milliman"), the premier global consulting and actuarial firm, today announced that Millennial Specialty Insurance, LLC ("MSI"), an indirect subsidiary of BRP Group, Inc. (NASDAQ: BRP), has chosen Milliman Bungalow ("Bungalow") as its insurtech platform for a complete flood insurance rating solution. Bungalow empowers insurers and MGAs to close the flood insurance protection gap while managing risk and profitability. It addresses the full product lifecycle for flood insurance, fr |
BRP Group, Inc. to Report Fourth Quarter 2022 Results on Tuesday, February 28, 2023TAMPA, Fla.--(BUSINESS WIRE)--BRP Group, Inc. (“BRP Group” or the “Company”) (NASDAQ: BRP), an independent insurance distribution firm delivering tailored insurance solutions, announced today that it will report its fourth quarter 2022 financial results after the market closes on Tuesday, February 28, 2023. The Company will hold a conference call to discuss results at 4:30 PM ET on that day. The dial-in number for the conference call is (877) 451-6152 (toll-free) or (201) 389-0879 (internationa |
Insiders might want to re-evaluate their US$6.5m stock purchase as BRP Group, Inc. (NASDAQ:BRP) drops to US$2.9bInsiders who acquired US$6.5m worth of BRP Group, Inc.'s ( NASDAQ:BRP ) stock at an average price of US$27.47 in the... |
10 Undervalued Insurance Stocks to Buy NowIn this article, we discuss the 10 undervalued insurance stocks to buy now. To skip the detailed analysis of the insurance industry, go directly to the 5 Undervalued Insurance Stocks to Buy Now. Insurance is one of the largest industries in the world. An estimated $5.5 trillion worth of insurance premiums were written in 2021, […] |
BRP Price Returns
1-mo | 11.15% |
3-mo | 13.32% |
6-mo | -2.78% |
1-year | 0.06% |
3-year | 81.28% |
5-year | N/A |
YTD | 22.51% |
2022 | -30.38% |
2021 | 20.49% |
2020 | 86.73% |
2019 | N/A |
2018 | N/A |
Loading social stream, please wait...