
Berry Petroleum Corporation (BRY): Price and Financial Metrics
BRY Price/Volume Stats
| Current price | $6.84 | 52-week high | $8.94 |
| Prev. close | $6.84 | 52-week low | $6.07 |
| Day low | $6.73 | Volume | 814,746 |
| Day high | $6.85 | Avg. volume | 1,023,857 |
| 50-day MA | $6.63 | Dividend yield | 7.2% |
| 200-day MA | $7.24 | Market Cap | 526.26M |
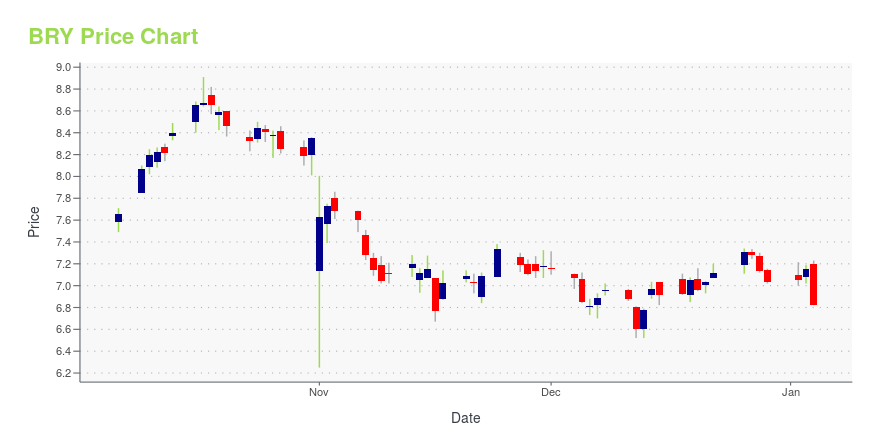
BRY Stock Price Chart Interactive Chart >
Berry Petroleum Corporation (BRY) Company Bio
Berry Petroleum Company, LLC, an independent energy company, engages in the acquisition, development, and production of conventional oil and natural gas reserves in the western United States. It holds interests in various petroleum assets that cover 119,290 net acres located in California, Utah, Colorado, and Texas. The company was founded in 1909 and is based in Bakersfield, California. Berry Petroleum Company, LLC operates as a subsidiary of Berry Petroleum Corporation.
Latest BRY News From Around the Web
Below are the latest news stories about BERRY CORP (BRY) that investors may wish to consider to help them evaluate BRY as an investment opportunity.
After Plunging -11.22% in 4 Weeks, Here's Why the Trend Might Reverse for Berry Petroleum (BRY)Berry Petroleum (BRY) is technically in oversold territory now, so the heavy selling pressure might have exhausted. This along with strong agreement among Wall Street analysts in raising earnings estimates could lead to a trend reversal for the stock. |
7 Earnings Losers to Load Up On Right NowGenerally speaking, earnings losers represent exactly that – companies that failed to deliver against established targets. |
Wall Street Analysts Predict a 33.29% Upside in Berry Petroleum (BRY): Here's What You Should KnowThe consensus price target hints at a 33.3% upside potential for Berry Petroleum (BRY). While empirical research shows that this sought-after metric is hardly effective, an upward trend in earnings estimate revisions could mean that the stock will witness an upside in the near term. |
Berry Petroleum (BRY) Q3 Earnings: How Key Metrics Compare to Wall Street EstimatesWhile the top- and bottom-line numbers for Berry Petroleum (BRY) give a sense of how the business performed in the quarter ended September 2023, it could be worth looking at how some of its key metrics compare to Wall Street estimates and year-ago values. |
Berry Corporation Reports Third Quarter 2023 ResultsDALLAS, Nov. 01, 2023 (GLOBE NEWSWIRE) -- Berry Corporation (bry) (NASDAQ: BRY) (“Berry” or the “Company”) announced third quarter 2023 results, including net loss of $45 million or $0.60 per diluted share, Adjusted Net Income(1) of $12 million or $0.15 per diluted share, cash flow from operating activities of $55 million and Adjusted EBITDA(1) of $70 million. Quarterly Highlights Produced 25,300 boe/d, higher than first half 2023, ~30% lower than planned annual capital expendituresGenerated Adj |
BRY Price Returns
| 1-mo | 9.09% |
| 3-mo | -20.44% |
| 6-mo | 4.23% |
| 1-year | -2.15% |
| 3-year | 77.92% |
| 5-year | -1.59% |
| YTD | 2.45% |
| 2023 | -0.36% |
| 2022 | 9.71% |
| 2021 | 135.53% |
| 2020 | -59.55% |
| 2019 | 13.17% |
BRY Dividends
| Ex-Dividend Date | Type | Payout Amount | Change | ||||||
|---|---|---|---|---|---|---|---|---|---|
| Loading, please wait... | |||||||||
Continue Researching BRY
Want to see what other sources are saying about Berry Petroleum Corp's financials and stock price? Try the links below:Berry Petroleum Corp (BRY) Stock Price | Nasdaq
Berry Petroleum Corp (BRY) Stock Quote, History and News - Yahoo Finance
Berry Petroleum Corp (BRY) Stock Price and Basic Information | MarketWatch
Loading social stream, please wait...