Bassett Furniture Industries, Incorporated (BSET): Price and Financial Metrics
GET POWR RATINGS... FREE!
BSET POWR Grades
- BSET scores best on the Sentiment dimension, with a Sentiment rank ahead of 97.36% of US stocks.
- BSET's strongest trending metric is Stability; it's been moving up over the last 160 days.
- BSET's current lowest rank is in the Growth metric (where it is better than 25.98% of US stocks).
BSET Stock Summary
- BSET's went public 37.25 years ago, making it older than 93.52% of listed US stocks we're tracking.
- BSET's current price/earnings ratio is 2.56, which is higher than merely 3.99% of US stocks with positive earnings.
- In terms of twelve month growth in earnings before interest and taxes, BASSETT FURNITURE INDUSTRIES INC is reporting a growth rate of 201.62%; that's higher than 92.64% of US stocks.
- Stocks with similar financial metrics, market capitalization, and price volatility to BASSETT FURNITURE INDUSTRIES INC are ETD, XPEL, FANH, BDL, and LZB.
- Visit BSET's SEC page to see the company's official filings. To visit the company's web site, go to www.bassettfurniture.com.
BSET Valuation Summary
- In comparison to the median Consumer Cyclical stock, BSET's price/sales ratio is 62.5% lower, now standing at 0.3.
- Over the past 243 months, BSET's price/earnings ratio has gone down 15.9.
Below are key valuation metrics over time for BSET.
Stock | Date | P/S | P/B | P/E | EV/EBIT |
---|---|---|---|---|---|
BSET | 2023-03-17 | 0.3 | 0.8 | 2.5 | 2.9 |
BSET | 2023-03-16 | 0.3 | 0.8 | 2.5 | 3.0 |
BSET | 2023-03-15 | 0.3 | 0.8 | 2.5 | 2.9 |
BSET | 2023-03-14 | 0.3 | 0.8 | 2.5 | 3.0 |
BSET | 2023-03-13 | 0.3 | 0.8 | 2.5 | 2.9 |
BSET | 2023-03-10 | 0.3 | 0.8 | 2.5 | 3.0 |
BSET Growth Metrics
- Its 3 year net cashflow from operations growth rate is now at -13.35%.
- The 3 year net income to common stockholders growth rate now stands at 101.29%.
- The 2 year price growth rate now stands at 242.15%.

The table below shows BSET's growth in key financial areas (numbers in millions of US dollars).
Date | Revenue | Operating Cash Flow | Net Income to Common Stock |
---|---|---|---|
2022-09-30 | 494.478 | -11.409 | 65.36 |
2022-06-30 | 495.372 | -6.433 | 60.748 |
2022-03-31 | 490.725 | 12.445 | 19.604 |
2021-12-31 | 486.534 | 14.563 | 18.042 |
2021-09-30 | 475.021 | 32.869 | 19.544 |
2021-06-30 | 447.674 | 54.472 | 18.706 |
BSET's Quality Factors
The “Quality” component of the POWR Ratings focuses on 31 different factors of a companies fundamentals and operational strength. Here are some key insights as we drill into the specifics of these quality attributes.- BSET has a Quality Grade of A, ranking ahead of 97.67% of graded US stocks.
- BSET's asset turnover comes in at 1.154 -- ranking 16th of 50 Consumer Goods stocks.
- IMAX, EL, and FOXF are the stocks whose asset turnover ratios are most correlated with BSET.
The table below shows BSET's key quality metrics over time.
Period | Asset Turnover | Gross Margin | ROIC |
---|---|---|---|
2021-08-28 | 1.154 | 0.513 | 0.079 |
2021-05-29 | 1.102 | 0.547 | 0.076 |
2021-02-27 | 0.973 | 0.570 | -0.035 |
2020-11-28 | 0.965 | 0.576 | -0.042 |
2020-08-29 | 1.035 | 0.584 | -0.095 |
2020-05-30 | 1.179 | 0.593 | -0.113 |
BSET Price Target
For more insight on analysts targets of BSET, see our BSET price target page. And for a list of of all stocks sorted by upside potential based on analyst target price, see our Top Price Target page.
Average Price Target | $34.00 | Average Broker Recommendation | 1.5 (Moderate Buy) |
BSET Stock Price Chart Interactive Chart >
BSET Price/Volume Stats
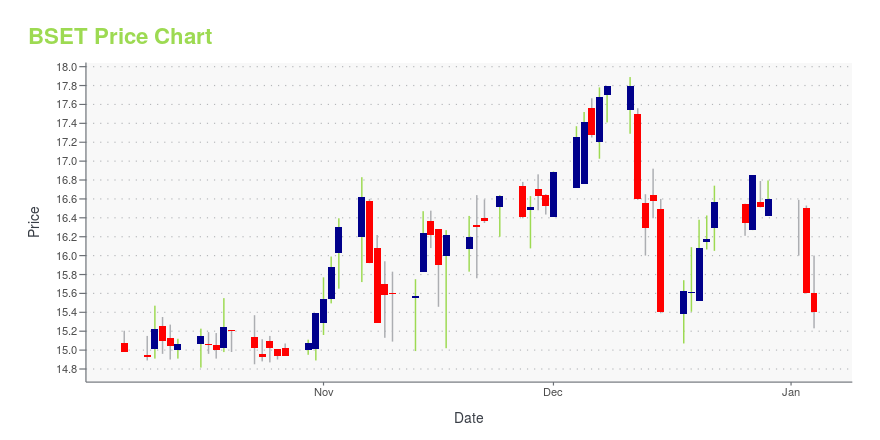
Current price | $19.04 | 52-week high | $24.12 |
Prev. close | $18.72 | 52-week low | $14.20 |
Day low | $18.39 | Volume | 19,000 |
Day high | $19.24 | Avg. volume | 21,640 |
50-day MA | $18.73 | Dividend yield | 3.42% |
200-day MA | $18.65 | Market Cap | 170.41M |
Bassett Furniture Industries, Incorporated (BSET) Company Bio
Bassett Furniture manufactures, imports, and retails home furnishings in the United States. The company was founded in 1902 and is based in Bassett, Virginia.
Latest BSET News From Around the Web
Below are the latest news stories about BASSETT FURNITURE INDUSTRIES INC that investors may wish to consider to help them evaluate BSET as an investment opportunity.
Analysts Estimate Bassett Furniture (BSET) to Report a Decline in Earnings: What to Look Out forBassett (BSET) doesn't possess the right combination of the two key ingredients for a likely earnings beat in its upcoming report. Get prepared with the key expectations. |
Bassett Regular Quarterly DividendBASSETT, Va, March 09, 2023 (GLOBE NEWSWIRE) -- Bassett Furniture Industries, Inc. (Nasdaq: BSET) announced today that its Board of Directors has declared a regular quarterly dividend of $0.16 per share of common stock, payable on May 26, 2023, to shareholders of record at the close of business on May 12, 2023. About Bassett Furniture Industries, Inc. Bassett Furniture Industries, Inc. (NASDAQ:BSET), is a leading manufacturer and marketer of high quality home furnishings. With 92 company- and li |
Bassett Furniture Posts Q4 Earnings Above Street ViewBassett Furniture Industries Inc (NASDAQ: BSET) reported fourth-quarter FY22 sales growth of 5.8% year-on-year to $121.02 million, beating the consensus of $111.60 million. Sales from Wholesale fell 1.6% Y/Y, and Retail increased by 14.9%. Gross margin expanded 240 basis points to 53.1%. Selling, general and administrative expenses rose 12% Y/Y to $57.5 million. The operating margin contracted Y/Y from 5.8% to 5.5%, and operating income for the quarter rose 1% to $6.7 million. EPS from continuin |
Bassett Furniture (BSET) Q4 Earnings and Revenues Surpass EstimatesBassett (BSET) delivered earnings and revenue surprises of 117.86% and 9.82%, respectively, for the quarter ended November 2022. Do the numbers hold clues to what lies ahead for the stock? |
Bassett Announces Fiscal Fourth Quarter ResultsBASSETT, Va., Jan. 24, 2023 (GLOBE NEWSWIRE) -- Bassett Furniture Industries, Inc. (Nasdaq: BSET) announced today its results of operations for its fourth quarter ended November 26, 2022. Fiscal 2022 Fourth Quarter Highlights of Continuing Operations (Dollars in millions) Sales Operating Income 4th Qtr Dollar% 4th Qtr% of 4th Qtr% of 2022 2021 ChangeChange 2022Sales 2021SalesConsolidated (1)$121.0$114.4 $6.6 5.8% $6.75.6% $6.65.8% Wholesale$74.6$76.0 $(1.4)-1.6% $0.91.2% $2.93.8% Retail$76.3$66. |
BSET Price Returns
1-mo | 1.12% |
3-mo | N/A |
6-mo | 18.88% |
1-year | 17.48% |
3-year | 241.97% |
5-year | -25.24% |
YTD | 10.48% |
2022 | 15.61% |
2021 | -14.53% |
2020 | 27.24% |
2019 | -14.06% |
2018 | -45.69% |
BSET Dividends
Ex-Dividend Date | Type | Payout Amount | Change | ||||||
---|---|---|---|---|---|---|---|---|---|
Loading, please wait... |
Continue Researching BSET
Want to see what other sources are saying about Bassett Furniture Industries Inc's financials and stock price? Try the links below:Bassett Furniture Industries Inc (BSET) Stock Price | Nasdaq
Bassett Furniture Industries Inc (BSET) Stock Quote, History and News - Yahoo Finance
Bassett Furniture Industries Inc (BSET) Stock Price and Basic Information | MarketWatch
Loading social stream, please wait...