BrightSphere Investment Group Inc. (BSIG): Price and Financial Metrics
BSIG Stock Summary
- BSIG's current price/earnings ratio is 5.26, which is higher than just 3.56% of US stocks with positive earnings.
- BSIG's equity multiplier -- a measure of assets relative to shareholders'equity -- is greater than that of 84.03% of US stocks.
- Shareholder yield, a measure of how much is returned to shareholders via dividends and share repurchases, for BSIG comes in at 15.12% -- higher than that of 88.38% of stocks in our set.
- Stocks that are quantitatively similar to BSIG, based on their financial statements, market capitalization, and price volatility, are FC, FCF, NSEC, AHC, and DJCO.
- BSIG's SEC filings can be seen here. And to visit BrightSphere Investment Group Inc's official web site, go to www.bsig.com.
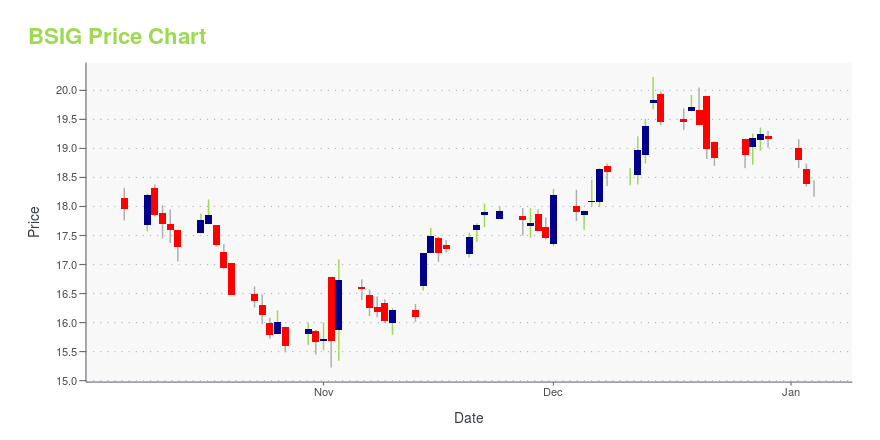
BSIG Stock Price Chart Interactive Chart >
BSIG Price/Volume Stats
Current price | $19.01 | 52-week high | $21.69 |
Prev. close | $19.20 | 52-week low | $3.61 |
Day low | $18.98 | Volume | 678,100 |
Day high | $19.59 | Avg. volume | 427,530 |
50-day MA | $19.63 | Dividend yield | 0.21% |
200-day MA | $15.10 | Market Cap | 1.52B |
BrightSphere Investment Group Inc. (BSIG) Company Bio
BrightSphere Investment Group (formerly, OM Asset Management LTD.) provides its services to individuals and institutions. It manages separate client focused portfolios through its subsidiaries. The firm was founded in 1980 is based Boston, Massachusetts.
BSIG Price Forecast Based on DCF Valuation
Current Price | DCF Fair Value Target: | Forecasted Gain: |
$19.01 | $2.02 | -89% |
Below please find a table outlining a discounted cash flow forecast for BSIG, in which we model out valuation assuming a variety of terminal growth rates. To summarize, we found that BrightSphere Investment Group Inc ranked in the 13th percentile in terms of potential gain offered. We should note, though, that all scenearios modelled for this stock suggest it is overvalued. As for the metrics that stood out in our discounted cash flow analysis of BrightSphere Investment Group Inc, consider:
- The company has produced more trailing twelve month cash flow than merely 24.2% of its sector Financial Services.
- BrightSphere Investment Group Inc's weighted average cost of capital (WACC) is 8%; for context, that number is higher than only 10.43% of tickers in our DCF set.
- BSIG's estimated cost of debt, based largely on its market capitalization and its interest coverage ratio, is 3%; for context, that number is higher than only 10.43% of tickers in our DCF set.
Terminal Growth Rate in Free Cash Flow | Return Relative to Current Share Price |
0% | -90% |
1% | -89% |
2% | -89% |
3% | -89% |
4% | -89% |
5% | -89% |
MN, ERIE, EZPW, GSHD, and WETF can be thought of as valuation peers to BSIG, in the sense that they are in the Financial Services sector and have a similar price forecast based on DCF valuation.
Latest BSIG News From Around the Web
Below are the latest news stories about BrightSphere Investment Group Inc that investors may wish to consider to help them evaluate BSIG as an investment opportunity.
BrightSphere Investment Group Inc. 2020 Q4 - Results - Earnings Call PresentationThe following slide deck was published by BrightSphere Investment Group Inc. in conjunction with their 2020 Q4 earnings call.... |
BrightSphere Investment Group Inc. (BSIG) CEO Suren Rana on Q4 2020 Results - Earnings Call TranscriptBrightSphere Investment Group Inc. (BSIG) Q4 2020 Earnings Conference Call February 4, 2021 11:00 ET Company Participants Elie Sugarman - Managing Director and Strategic Development Suren Rana - President and Chief Executive Officer Conference Call Participants Craig Siegenthaler - Credit Suisse Michael Cyprys - Morgan Stanley Kenneth Lee - RBC... |
Brightsphere Investment Group PLC. (BSIG) Q4 2020 Earnings Call TranscriptImage source: The Motley Fool. Brightsphere Investment Group PLC. (NYSE: BSIG)Q4 2020 Earnings CallFeb 4, 2021, 11:00 a.m. ETContents: Prepared Remarks Questions and Answers Call Participants Prepared Remarks: OperatorLadies and gentlemen, thank you for standing by. |
BrightSphere Investment Group Inc to Host Earnings CallNEW YORK, NY / ACCESSWIRE / February 4, 2021 / BrightSphere Investment Group Inc (NYSE:BSIG) will be discussing their earnings results in their 2020 Fourth Quarter Earnings call to be held on February 4, 2021 at 11:00 AM Eastern Time.To listen to the event live or access a replay of the call - visit https://www. |
BrightSphere Reports Financial and Operating Results for the Fourth Quarter Ended December 31, 2020BrightSphere Investment Group Inc. (NYSE: BSIG) today announced its results for the fourth quarter ended December 31, 2020. |
BSIG Price Returns
1-mo | -0.42% |
3-mo | -0.89% |
6-mo | 40.68% |
1-year | 131.13% |
3-year | 33.38% |
5-year | 75.40% |
YTD | -1.40% |
2020 | 93.85% |
2019 | -2.42% |
2018 | -35.88% |
2017 | 18.28% |
2016 | -3.11% |
BSIG Dividends
Ex-Dividend Date | Type | Payout Amount | Change | ||||||
---|---|---|---|---|---|---|---|---|---|
Loading, please wait... |
Continue Researching BSIG
Here are a few links from around the web to help you further your research on BrightSphere Investment Group Inc's stock as an investment opportunity:BrightSphere Investment Group Inc (BSIG) Stock Price | Nasdaq
BrightSphere Investment Group Inc (BSIG) Stock Quote, History and News - Yahoo Finance
BrightSphere Investment Group Inc (BSIG) Stock Price and Basic Information | MarketWatch
Get Free Updates
Join thousands of investors who get the latest news, insights and top rated picks from StockNews.com!
Loading social stream, please wait...