
Boston Scientific Corp. (BSX): Price and Financial Metrics
BSX Price/Volume Stats
| Current price | $74.92 | 52-week high | $79.43 |
| Prev. close | $74.26 | 52-week low | $48.35 |
| Day low | $74.42 | Volume | 7,973,424 |
| Day high | $75.67 | Avg. volume | 6,297,720 |
| 50-day MA | $76.40 | Dividend yield | N/A |
| 200-day MA | $65.22 | Market Cap | 109.91B |
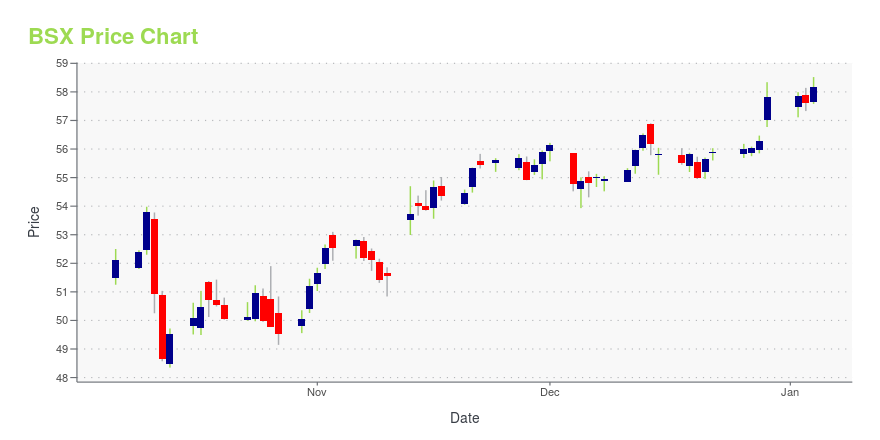
BSX Stock Price Chart Interactive Chart >
Boston Scientific Corp. (BSX) Company Bio
Boston Scientific Corporation, doing business as Boston Scientific, is a manufacturer of medical devices used in interventional medical specialties, including interventional radiology, interventional cardiology, peripheral interventions, neuromodulation, neurovascular intervention, electrophysiology, cardiac surgery, vascular surgery, endoscopy, oncology, urology and gynecology. (Source:Wikipedia)
Latest BSX News From Around the Web
Below are the latest news stories about BOSTON SCIENTIFIC CORP that investors may wish to consider to help them evaluate BSX as an investment opportunity.
Boston Sci sees Farapulse PFA receiving FDA approval in Q1More on Boston Scientific |
Boston Scientific Initiates AVANT GUARD Clinical Trial to Evaluate FARAPULSE™ Pulsed Field Ablation System as First-Line Treatment for Persistent Atrial FibrillationBoston Scientific Corporation (NYSE: BSX) has initiated the AVANT GUARD clinical trial to evaluate the safety and effectiveness of the FARAPULSE™ Pulsed Field Ablation (PFA) System* as a first-line treatment for persistent atrial fibrillation (AF), the only trial to study the use of PFA as frontline therapy in patients with this form of AF. Outcomes of ablation with the FARAPULSE PFA System – a nonthermal treatment in which electric fields selectively ablate heart tissue – will be compared to ou |
3 Medical-Device Stocks Could Click in 2024Baird is bullish on Boston Scientific, Insulet, and DexCom, stocks set to benefit as those companies ramp up sales. |
Show Me The Money: Inside Ken Griffin's Citadel's Jaw-Dropping $7 Billion ReturnCitadel Founder and CEO Ken Griffin is one of the most successful investors of all time, managing over $62 billion in assets. He is also the founder of Citadel Securities, the largest market-making firm for the New York Stock Exchange and one of the largest designated market makers in the world. Citadel Securities is involved in one out of four stock trades placed in U.S. exchanges and nearly 40% of all retail trades. With a net worth of $37.5 billion, Griffin is one of the richest hedge fund ma |
Insider Sell Alert: EVP Wendy Carruthers Sells 11,672 Shares of Boston Scientific Corp (BSX)Boston Scientific Corp (NYSE:BSX), a leading innovator in medical solutions that improve the health of patients around the world, has recently witnessed a significant insider sell by one of its top executives. |
BSX Price Returns
| 1-mo | -2.83% |
| 3-mo | 2.39% |
| 6-mo | 22.56% |
| 1-year | 42.33% |
| 3-year | 64.62% |
| 5-year | 78.04% |
| YTD | 29.60% |
| 2023 | 24.94% |
| 2022 | 8.92% |
| 2021 | 18.16% |
| 2020 | -20.50% |
| 2019 | 27.96% |
Continue Researching BSX
Want to see what other sources are saying about Boston Scientific Corp's financials and stock price? Try the links below:Boston Scientific Corp (BSX) Stock Price | Nasdaq
Boston Scientific Corp (BSX) Stock Quote, History and News - Yahoo Finance
Boston Scientific Corp (BSX) Stock Price and Basic Information | MarketWatch
Loading social stream, please wait...