Babcock & Wilcox Enterprises, Inc. (BW): Price and Financial Metrics


Babcock & Wilcox Enterprises, Inc. (BW): $5.56

0.03 (+0.54%)

POWR Rating

Component Grades

Growth

S

Value

I

Momentum

G

Stability

N

Sentiment

U

Quality

P

BW POWR Grades

  • Momentum is the dimension where BW ranks best; there it ranks ahead of 77.69% of US stocks.
  • BW's strongest trending metric is Stability; it's been moving up over the last 179 days.
  • BW ranks lowest in Quality; there it ranks in the 18th percentile.

BW Stock Summary

  • The capital turnover (annual revenue relative to shareholder's equity) for BW is -345.69 -- better than merely 0.02% of US stocks.
  • BW's price/sales ratio is 0.56; that's higher than the P/S ratio of only 19.57% of US stocks.
  • Equity multiplier, or assets relative to shareholders' equity, comes in at 666.34 for BABCOCK & WILCOX ENTERPRISES INC; that's greater than it is for 99.98% of US stocks.
  • If you're looking for stocks that are quantitatively similar to BABCOCK & WILCOX ENTERPRISES INC, a group of peers worth examining would be JILL, AVAH, TPX, GB, and UIS.
  • BW's SEC filings can be seen here. And to visit BABCOCK & WILCOX ENTERPRISES INC's official web site, go to www.babcock.com.

BW Valuation Summary

  • BW's price/sales ratio is 0.6; this is 66.67% lower than that of the median Industrials stock.
  • BW's price/sales ratio has moved down 0.1 over the prior 94 months.

Below are key valuation metrics over time for BW.

Stock Date P/S P/B P/E EV/EBIT
BW 2023-03-17 0.6 -192.7 -13.1 24.6
BW 2023-03-16 0.5 -189.9 -13.0 24.4
BW 2023-03-15 0.6 -26.5 -34.4 20.9
BW 2023-03-14 0.6 -26.7 -34.6 21.0
BW 2023-03-13 0.6 -25.9 -33.7 20.7
BW 2023-03-10 0.6 -27.4 -35.6 21.4

BW Growth Metrics

    Its 4 year net income to common stockholders growth rate is now at 22.12%.
  • Its 4 year net cashflow from operations growth rate is now at -403.93%.
  • Its 2 year price growth rate is now at 293.89%.
BW's revenue has moved down $26,878,000 over the prior 33 months.

The table below shows BW's growth in key financial areas (numbers in millions of US dollars).

Date Revenue Operating Cash Flow Net Income to Common Stock
2022-09-30 832.233 -70.742 -13.868
2022-06-30 777.323 -88.712 17.575
2022-03-31 759.164 -99.241 25.252
2021-12-31 723.363 -111.196 21.767
2021-09-30 680.921 -81.344 0.481
2021-06-30 653.474 -77.559 25.243

BW's Quality Factors

The “Quality” component of the POWR Ratings focuses on 31 different factors of a companies fundamentals and operational strength. Here are some key insights as we drill into the specifics of these quality attributes.
  • BW has a Quality Grade of D, ranking ahead of 13.03% of graded US stocks.
  • BW's asset turnover comes in at 1.069 -- ranking 19th of 60 Construction Materials stocks.
  • SCX, NOBH, and OFLX are the stocks whose asset turnover ratios are most correlated with BW.

The table below shows BW's key quality metrics over time.

Period Asset Turnover Gross Margin ROIC
2021-06-30 1.069 0.276 0.167
2021-03-31 0.994 0.288 0.126
2020-12-31 0.955 0.293 0.100
2020-09-30 0.992 0.282 0.156
2020-06-30 1.072 0.229 0.008
2020-03-31 1.163 0.211 0.020

BW Price Target

For more insight on analysts targets of BW, see our BW price target page. And for a list of of all stocks sorted by upside potential based on analyst target price, see our Top Price Target page.

Average Price Target $9.18 Average Broker Recommendation 1.75 (Moderate Buy)

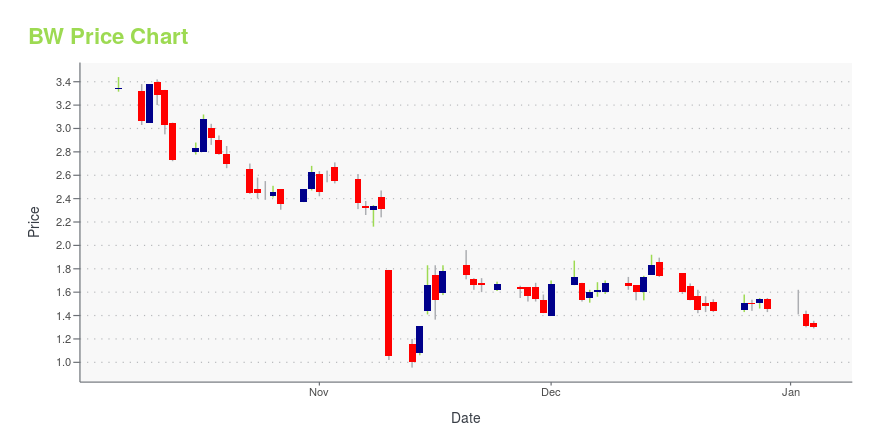
BW Stock Price Chart Interactive Chart >

Price chart for BW

BW Price/Volume Stats

Current price $5.56 52-week high $8.76
Prev. close $5.53 52-week low $3.89
Day low $5.33 Volume 475,400
Day high $5.62 Avg. volume 404,616
50-day MA $6.21 Dividend yield N/A
200-day MA $6.37 Market Cap 493.35M

Babcock & Wilcox Enterprises, Inc. (BW) Company Bio


Babcock & Wilcox Enterprises, Inc. provides energy and environmental technologies and services for the power and industrial markets worldwide. The company was founded in 1867 and is based in Charlotte, North Carolina.


BW Latest News Stream


Event/Time News Detail
Loading, please wait...

BW Latest Social Stream


Loading social stream, please wait...

View Full BW Social Stream

Latest BW News From Around the Web

Below are the latest news stories about BABCOCK & WILCOX ENTERPRISES INC that investors may wish to consider to help them evaluate BW as an investment opportunity.

Babcock & Wilcox wins $9M contract to supply cooling systems in the Middle East

  • Babcock & Wilcox (NYSE:BW) said its B&W Environmental business segment has been awarded a $9M contract to design and supply two cooling systems for a clean hydrogen production facility in the Middle East.
  • The company will supply two SPIG fiberglass-reinforced polymer cooling towers to provide efficient, low-emissions cooling for a plant that will use renewable ...

    Seeking Alpha | March 20, 2023

Babcock & Wilcox Awarded $9 Million Contract to Supply Cooling Systems for Middle East Green Hydrogen Project

AKRON, Ohio, March 20, 2023--B&W has been awarded a contract for more than $9 million to design and supply cooling systems for a hydrogen production facility in the Middle East.

Yahoo | March 20, 2023

Babcock & Wilcox Enterprises, Inc. (NYSE:BW) Q4 2022 Earnings Call Transcript

Babcock & Wilcox Enterprises, Inc. (NYSE:BW) Q4 2022 Earnings Call Transcript March 15, 2023 Operator: Hello, everyone and welcome to the Babcock and Wilcox Q4 and Full-Year 2022 Earnings Conference Call. My name is Emily and I’ll be coordinating your call today. I will now turn the call over to our host, Sharyn Brooks; Director […]

Yahoo | March 20, 2023

Is There Now An Opportunity In Babcock & Wilcox Enterprises, Inc. (NYSE:BW)?

While Babcock & Wilcox Enterprises, Inc. ( NYSE:BW ) might not be the most widely known stock at the moment, it...

Yahoo | March 16, 2023

Babcock & Wilcox Enterprises Reports Fourth Quarter and Full Year 2022 Results

AKRON, Ohio, March 15, 2023--Babcock & Wilcox Enterprises, Inc. ("B&W" or the "Company") (NYSE: BW) announced results for the fourth quarter and full year 2022.

Yahoo | March 15, 2023

Read More 'BW' Stories Here

BW Price Returns

1-mo -13.13%
3-mo N/A
6-mo -13.26%
1-year -34.20%
3-year 355.74%
5-year -87.39%
YTD -3.64%
2022 -36.03%
2021 156.98%
2020 -3.57%
2019 -6.67%
2018 -93.13%

Get Free Updates

Join thousands of investors who get the latest news, insights and top rated picks from StockNews.com!


Page generated in 0.8721 seconds.