
Bankwell Financial Group, Inc. (BWFG): Price and Financial Metrics
BWFG Price/Volume Stats
| Current price | $40.90 | 52-week high | $41.46 |
| Prev. close | $41.17 | 52-week low | $25.79 |
| Day low | $40.48 | Volume | 15,676 |
| Day high | $41.08 | Avg. volume | 17,557 |
| 50-day MA | $37.43 | Dividend yield | 1.96% |
| 200-day MA | $0.00 | Market Cap | 322.01M |
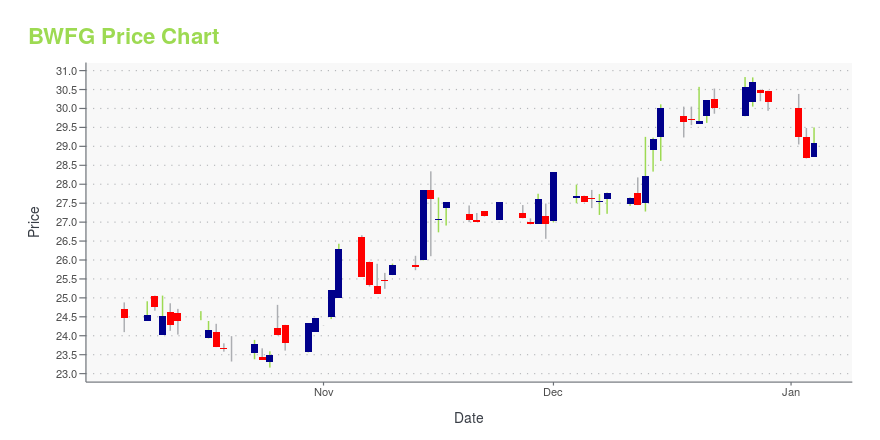
BWFG Stock Price Chart Interactive Chart >
Bankwell Financial Group, Inc. (BWFG) Company Bio
Bankwell Financial Group, Inc. provides a range of banking services to commercial and consumer customers in Connecticut. The company was founded in 2002 and is headquartered in New Canaan, Connecticut.
BWFG Price Returns
| 1-mo | 10.35% |
| 3-mo | 15.96% |
| 6-mo | 32.01% |
| 1-year | 62.70% |
| 3-year | 31.78% |
| 5-year | 195.66% |
| YTD | 33.58% |
| 2024 | 6.40% |
| 2023 | 5.76% |
| 2022 | -8.20% |
| 2021 | 71.96% |
| 2020 | -29.99% |
BWFG Dividends
| Ex-Dividend Date | Type | Payout Amount | Change | ||||||
|---|---|---|---|---|---|---|---|---|---|
| Loading, please wait... | |||||||||
Continue Researching BWFG
Here are a few links from around the web to help you further your research on Bankwell Financial Group Inc's stock as an investment opportunity:Bankwell Financial Group Inc (BWFG) Stock Price | Nasdaq
Bankwell Financial Group Inc (BWFG) Stock Quote, History and News - Yahoo Finance
Bankwell Financial Group Inc (BWFG) Stock Price and Basic Information | MarketWatch
Loading social stream, please wait...