
Boston Properties Inc. (BXP): Price and Financial Metrics
BXP Price/Volume Stats
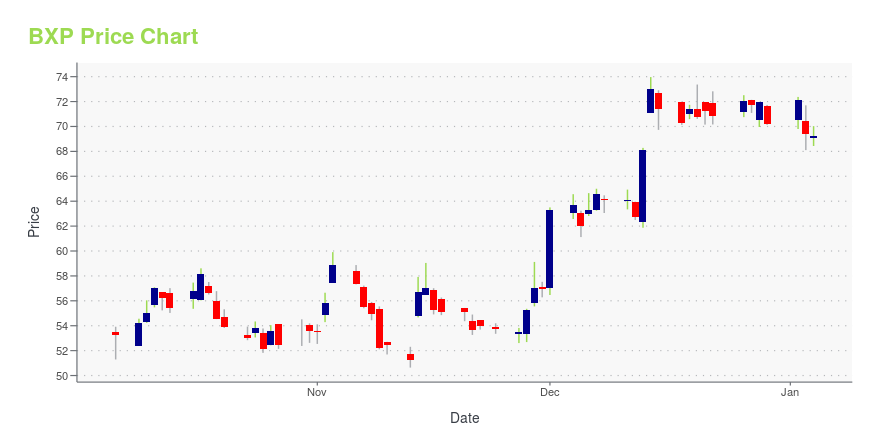
| Current price | $70.50 | 52-week high | $73.97 |
| Prev. close | $67.91 | 52-week low | $50.64 |
| Day low | $68.64 | Volume | 914,200 |
| Day high | $70.56 | Avg. volume | 1,321,120 |
| 50-day MA | $62.58 | Dividend yield | 5.67% |
| 200-day MA | $62.61 | Market Cap | 11.07B |
BXP Stock Price Chart Interactive Chart >
Boston Properties Inc. (BXP) Company Bio
Boston Properties, Inc. is a publicly traded real estate investment trust that invests in office buildings in Boston, Los Angeles, New York City, San Francisco, and Washington, D.C. As of December 31, 2019, the company owned or had interests in 196 commercial real estate properties, aggregating approximately 52.0 million net rentable square feet. (Source:Wikipedia)
Latest BXP News From Around the Web
Below are the latest news stories about BOSTON PROPERTIES INC that investors may wish to consider to help them evaluate BXP as an investment opportunity.
Investing in REITs: One stock to buy and one to avoidReal Estate Investment Trusts or REITs have been hit by issues such as high interest rates, lackluster return to office, and overall concerns about an economic slowdown. Infrastructure Capital Advisors CEO Jay Hatfield gives his take on the space in the latest Good Buy or Goodbye. Hatfield is buying Boston Properties (BXP) because he believes the stock will rally as interest rates fall and that it has an attractive valuation. He also likes the stock because, even though they do have office properties, Hatfield says they tend to cater to sectors that favor work from the office. A stock Hatfield is avoiding is Prologis (PLD), which owns warehouses. Hatfield says that, unlike office space, warehouse space is "easy to replicate," which means there is a lot of new space coming online. Hatfie... |
BXP Declares Regular Quarterly DividendBOSTON, December 18, 2023--Boston Properties, Inc. (NYSE: BXP), the largest publicly traded developer, owner, and manager of premier workplaces in the United States, announced today that its Board of Directors declared a regular quarterly cash dividend of $0.98 per share of common stock for the period October 1, 2023 to December 31, 2023, payable on January 30, 2024 to shareholders of record as of the close of business on December 29, 2023. |
Today's Big Winners: Real-Estate and Utility StocksReal-estate and utility stocks jumped to one of their best days of the year following [the Fed's decision](https://www.wsj.com/economy/central-banking/fed-holds-rates-steady-and-sees-cuts-next-year-4d554e9f) to hold borrowing costs steady and the central bank's opening the door to interest-rate cuts next year. |
Boston Properties (BXP) Up 19% in 6 Months: Will the Trend Last?Healthy demand for premier office spaces and life-science asset expansions will likely aid Boston Properties' (BXP) performance. Yet, a choppy office market scenario and high interest rates are woes. |
Should You Buy the 5 Highest-Paying Dividend Stocks in the S&P 500?Income investors basically want two things from their dividends: as much money as possible, with the greatest level of safety as possible. There are plenty of places to get ideas for dividend stocks that might check off both boxes. One is the S&P 500. |
BXP Price Returns
| 1-mo | 17.28% |
| 3-mo | 16.48% |
| 6-mo | 2.27% |
| 1-year | 16.18% |
| 3-year | -28.68% |
| 5-year | -31.83% |
| YTD | 3.77% |
| 2023 | 10.98% |
| 2022 | -38.57% |
| 2021 | 26.21% |
| 2020 | -28.33% |
| 2019 | 26.09% |
BXP Dividends
| Ex-Dividend Date | Type | Payout Amount | Change | ||||||
|---|---|---|---|---|---|---|---|---|---|
| Loading, please wait... | |||||||||
Continue Researching BXP
Want to see what other sources are saying about Boston Properties Inc's financials and stock price? Try the links below:Boston Properties Inc (BXP) Stock Price | Nasdaq
Boston Properties Inc (BXP) Stock Quote, History and News - Yahoo Finance
Boston Properties Inc (BXP) Stock Price and Basic Information | MarketWatch
Loading social stream, please wait...