Boyd Gaming Corporation (BYD): Price and Financial Metrics
BYD Price/Volume Stats
Current price | $60.88 | 52-week high | $73.00 |
Prev. close | $60.68 | 52-week low | $47.18 |
Day low | $60.82 | Volume | 41,187 |
Day high | $61.44 | Avg. volume | 846,213 |
50-day MA | $65.68 | Dividend yield | 1.06% |
200-day MA | $64.63 | Market Cap | 6.09B |
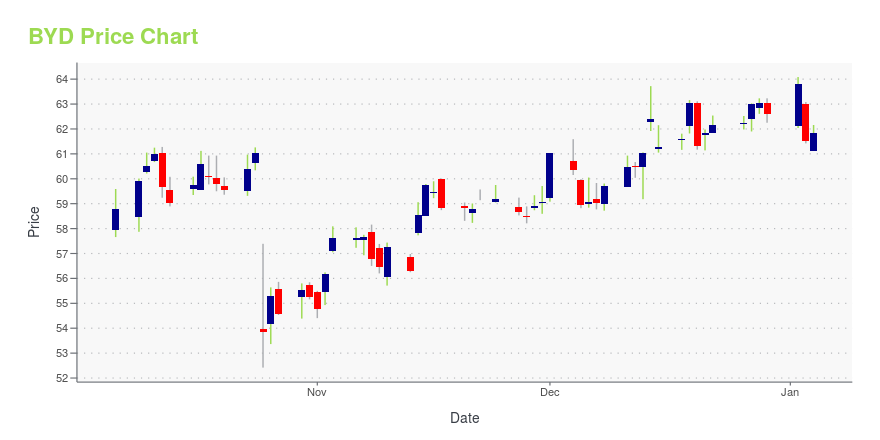
BYD Stock Price Chart Interactive Chart >
BYD POWR Grades
- BYD scores best on the Quality dimension, with a Quality rank ahead of 97.5% of US stocks.
- The strongest trend for BYD is in Stability, which has been heading up over the past 177 days.
- BYD's current lowest rank is in the Growth metric (where it is better than 20.67% of US stocks).
BYD Stock Summary
- BYD has a market capitalization of $6,079,732,033 -- more than approximately 78.71% of US stocks.
- BOYD GAMING CORP's stock had its IPO on October 18, 1993, making it an older stock than 78.23% of US equities in our set.
- In terms of volatility of its share price, BYD is more volatile than merely 13.54% of stocks we're observing.
- If you're looking for stocks that are quantitatively similar to BOYD GAMING CORP, a group of peers worth examining would be NXST, KORE, MOS, WRK, and SUM.
- Visit BYD's SEC page to see the company's official filings. To visit the company's web site, go to www.boydgaming.com.
BYD Valuation Summary
- In comparison to the median Consumer Cyclical stock, BYD's EV/EBIT ratio is 34.98% lower, now standing at 9.2.
- Over the past 243 months, BYD's price/earnings ratio has gone down 20.6.
Below are key valuation metrics over time for BYD.
Stock | Date | P/S | P/B | P/E | EV/EBIT |
---|---|---|---|---|---|
BYD | 2023-09-13 | 1.7 | 3.6 | 8.8 | 9.2 |
BYD | 2023-09-12 | 1.7 | 3.7 | 8.9 | 9.3 |
BYD | 2023-09-11 | 1.7 | 3.6 | 8.8 | 9.3 |
BYD | 2023-09-08 | 1.8 | 3.7 | 9.0 | 9.4 |
BYD | 2023-09-07 | 1.8 | 3.7 | 8.9 | 9.3 |
BYD | 2023-09-06 | 1.8 | 3.7 | 9.0 | 9.4 |
BYD Growth Metrics
- Its year over year cash and equivalents growth rate is now at -43.97%.
- The 3 year revenue growth rate now stands at 22.1%.
- Its 2 year net income to common stockholders growth rate is now at 1583.05%.

The table below shows BYD's growth in key financial areas (numbers in millions of US dollars).
Date | Revenue | Operating Cash Flow | Net Income to Common Stock |
---|---|---|---|
2022-09-30 | 3,512.297 | 960.729 | 576.475 |
2022-06-30 | 3,478.094 | 967.281 | 557.647 |
2022-03-31 | 3,477.246 | 1,027.434 | 524.613 |
2021-12-31 | 3,369.81 | 1,010.411 | 463.846 |
2021-09-30 | 3,125.837 | 942.735 | 437.351 |
2021-06-30 | 2,935.015 | 841.179 | 337.293 |
BYD's Quality Factors
The “Quality” component of the POWR Ratings focuses on 31 different factors of a companies fundamentals and operational strength. Here are some key insights as we drill into the specifics of these quality attributes.- BYD has a Quality Grade of A, ranking ahead of 96.31% of graded US stocks.
- BYD's asset turnover comes in at 0.48 -- ranking 44th of 79 Restaraunts Hotels Motels stocks.
- TNL, YUM, and PLYA are the stocks whose asset turnover ratios are most correlated with BYD.
The table below shows BYD's key quality metrics over time.
Period | Asset Turnover | Gross Margin | ROIC |
---|---|---|---|
2021-09-30 | 0.480 | 0.572 | 0.102 |
2021-06-30 | 0.449 | 0.573 | 0.087 |
2021-03-31 | 0.330 | 0.561 | 0.048 |
2020-12-31 | 0.316 | 0.524 | 0.007 |
2020-09-30 | 0.343 | 0.502 | -0.001 |
2020-06-30 | 0.366 | 0.472 | -0.003 |
BYD Price Target
For more insight on analysts targets of BYD, see our BYD price target page. And for a list of of all stocks sorted by upside potential based on analyst target price, see our Top Price Target page.
Average Price Target | $81.55 | Average Broker Recommendation | 1.5 (Moderate Buy) |
Boyd Gaming Corporation (BYD) Company Bio
Boyd Gaming owns and operates gaming entertainment properties located in Nevada, Illinois, Indiana, Iowa, Kansas, Louisiana, Mississippi and New Jersey. The company was founded in 1988 and is based in Las Vegas, Nevada.
Latest BYD News From Around the Web
Below are the latest news stories about BOYD GAMING CORP that investors may wish to consider to help them evaluate BYD as an investment opportunity.
Why Investors Need to Take Advantage of These 2 Consumer Discretionary Stocks NowThe Zacks Earnings ESP is a great way to find potential earnings surprises. Why investors should take advantage now. |
Long-Term Returns of Paul Singer’s Activist TargetsIn this article, we discuss long-term returns of Paul Singer’s activist targets. If you want to see more stocks in this selection, check out Long Term Returns of Paul Singer’s 5 Activist Targets. Paul Singer is the brain behind Elliot Management, one of the oldest hedge funds with over $50 billion in assets under management. The […] |
Here's Why We Think Boyd Gaming (NYSE:BYD) Might Deserve Your Attention TodayThe excitement of investing in a company that can reverse its fortunes is a big draw for some speculators, so even... |
3 Stocks to Watch in the TradeSmith ‘Green Zone’Now may be the time to take a look at these three stocks to watch, each of which are currently in the "Green Zone." |
7 Oversold Stocks Begging for a Spot in Your PortfolioEach one of these seven oversold stock opportunities is technically oversold and/or fundamentally oversold. |
BYD Price Returns
1-mo | -8.16% |
3-mo | -12.02% |
6-mo | -4.59% |
1-year | 28.18% |
3-year | 106.68% |
5-year | 85.95% |
YTD | 12.49% |
2022 | -15.74% |
2021 | 52.77% |
2020 | 43.35% |
2019 | 45.51% |
2018 | -40.25% |
BYD Dividends
Ex-Dividend Date | Type | Payout Amount | Change | ||||||
---|---|---|---|---|---|---|---|---|---|
Loading, please wait... |
Continue Researching BYD
Want to see what other sources are saying about Boyd Gaming Corp's financials and stock price? Try the links below:Boyd Gaming Corp (BYD) Stock Price | Nasdaq
Boyd Gaming Corp (BYD) Stock Quote, History and News - Yahoo Finance
Boyd Gaming Corp (BYD) Stock Price and Basic Information | MarketWatch
Loading social stream, please wait...