
BeyondSpring, Inc. - Ordinary Shares (BYSI): Price and Financial Metrics
BYSI Price/Volume Stats
| Current price | $1.97 | 52-week high | $4.00 |
| Prev. close | $2.07 | 52-week low | $0.65 |
| Day low | $1.96 | Volume | 13,294 |
| Day high | $2.10 | Avg. volume | 125,909 |
| 50-day MA | $2.48 | Dividend yield | N/A |
| 200-day MA | $1.78 | Market Cap | 76.89M |
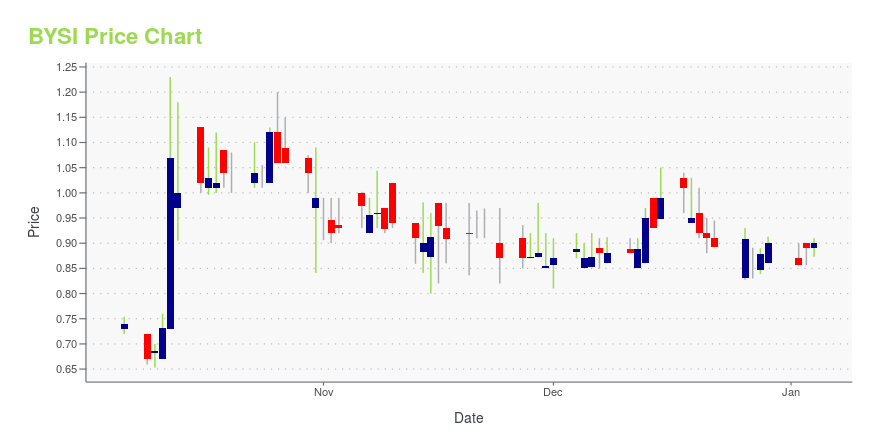
BYSI Stock Price Chart Interactive Chart >
BeyondSpring, Inc. - Ordinary Shares (BYSI) Company Bio
BeyondSpring is a global clinical stage biopharmaceutical company developing innovative immuno-oncology cancer therapies. The co is advancing its lead asset, Plinabulin, into a Phase 3 clinical trial as a direct anticancer agent in non-small cell lung cancer and a Phase 2/3 clinical trial in the prevention of chemotherapy-induced Neutropenia.
Latest BYSI News From Around the Web
Below are the latest news stories about BEYONDSPRING INC that investors may wish to consider to help them evaluate BYSI as an investment opportunity.
BeyondSpring Presents Poster Highlighting Preclinical and Clinical POC Immunomodulating Activity of Plinabulin Inducing Dendritic Cell Maturation and Re-sensitization in Immunotherapy Refractory Tumors when Combined with Radiation and PD-1/PD-L1 InhibitorsNew Clinical Data from MD Anderson Presented at the Society for Immunotherapy of Cancer’s 38th Annual Meeting80% DCR (disease control rate) in non-radiated tumor with Durable Responses in Heavily Pretreated Patients in 6 different cancersFull data was presented at SITC’s 38th Annual Meeting; The Company will host a call at 8:30 a.m. ET today. Dial in: 877-407-0792, conference title: Clinical Significance of Plinabulin SITC Presentation with PI Dr. Steven Lin from MD Anderson NEW YORK, Nov. 07, 2 |
BeyondSpring and Professor K. Eisenmann of the University of Toledo College of Medicine Present Poster Highlighting Plinabulin’s Anti-cancer Efficacy in Primary and Recurrent Glioblastoma Patient Derived Invasive Neurosphere ModelsNew Preclinical Data from University of Toledo College of Medicine Presented at 2023 AACR Special Conference in Cancer Research: Brain CancerNEW YORK, Oct. 31, 2023 (GLOBE NEWSWIRE) -- BeyondSpring Inc. (NASDAQ: BYSI) (“BeyondSpring” or the “Company”), a global clinical-stage biopharmaceutical company focused on using a groundbreaking technology platform for drug discovery and developing innovative therapies to improve clinical outcomes for patients with high unmet medical needs, today announced |
BeyondSpring Regains Compliance with Nasdaq Minimum Bid Price RequirementNEW YORK, Oct. 30, 2023 (GLOBE NEWSWIRE) -- BeyondSpring Inc. (NASDAQ: BYSI) (“BeyondSpring” or the “Company”), a global clinical-stage biopharmaceutical company focused on using a groundbreaking technology platform for drug discovery and developing innovative therapies to improve clinical outcomes for patients with high unmet medical needs, today announced that on October 27, 2023, it received a written notification (the “Notification Letter on Compliance”) from the Listing Qualifications Depar |
SEED Therapeutics Discloses Novel Molecular Glue IND Candidate for Cancer at “Targeted Protein Degradation Think Tank” SymposiumNEW YORK, Oct. 26, 2023 (GLOBE NEWSWIRE) -- SEED Therapeutics Inc. (“SEED”), a biotech company focused on harnessing and engineering Molecular Glues for targeted protein degradation (TPD) of disease-causing proteins, announced at its Monday, October 23, 2023 Targeted Protein Degradation (TPD) Think Tank symposium that it had successfully discovered a ST-00937, a new chemical entity (NCE) molecular glue that has already achieved IND Candidate status and will be advanced for the treatment of cance |
SEED Therapeutics, a BeyondSpring Subsidiary, Appoints Mr. Ko-Yung Tung to the Board of DirectorsFormer Eisai Board Member, Former World Bank General Counsel, and Lecturer at Harvard and Yale Law Schools, Brings Five Decades of Experience in Global Health, Law, Governance, and International BusinessNEW YORK, Oct. 23, 2023 (GLOBE NEWSWIRE) -- SEED Therapeutics (SEED), an innovative global biotech company focused on engineering “molecular glues” and harnessing its targeted protein degradation (TPD) platform to attack previously undruggable targets, has appointed eminent international lawyer K |
BYSI Price Returns
| 1-mo | -19.26% |
| 3-mo | -7.51% |
| 6-mo | 116.44% |
| 1-year | 93.14% |
| 3-year | -78.73% |
| 5-year | -88.30% |
| YTD | 118.89% |
| 2023 | -52.13% |
| 2022 | -58.50% |
| 2021 | -62.87% |
| 2020 | -21.29% |
| 2019 | -17.33% |
Loading social stream, please wait...