
Beazer Homes USA, Inc. (BZH): Price and Financial Metrics
BZH Price/Volume Stats
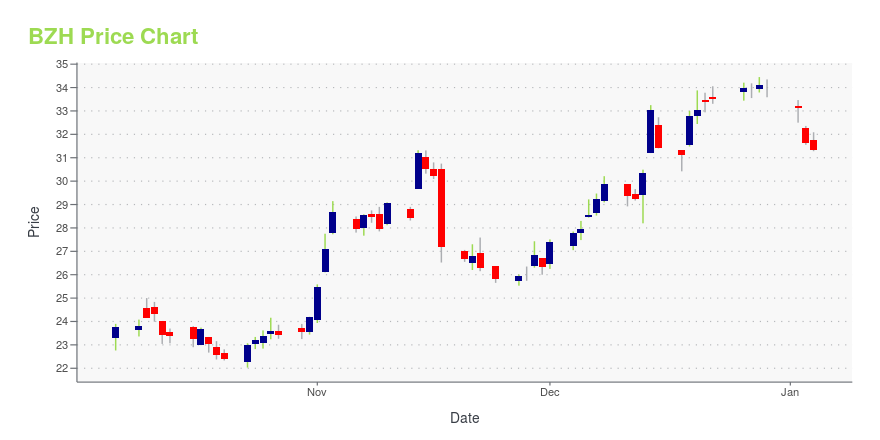
| Current price | $33.84 | 52-week high | $35.93 |
| Prev. close | $32.73 | 52-week low | $22.03 |
| Day low | $33.52 | Volume | 327,814 |
| Day high | $34.68 | Avg. volume | 360,924 |
| 50-day MA | $28.86 | Dividend yield | N/A |
| 200-day MA | $29.11 | Market Cap | 1.07B |
BZH Stock Price Chart Interactive Chart >
Beazer Homes USA, Inc. (BZH) Company Bio
Beazer Homes designs, builds, and sells single-family and multi-family homes in Arizona, California, Delaware, Florida, Georgia, Indiana, Maryland, Nevada, New Jersey, New York, North Carolina, Pennsylvania, South Carolina, Tennessee, Texas, and Virginia. The company was founded in 1985 and is based in Atlanta, Georgia.
Latest BZH News From Around the Web
Below are the latest news stories about BEAZER HOMES USA INC that investors may wish to consider to help them evaluate BZH as an investment opportunity.
Can homebuilder stocks defy the odds in 2024?Homebuilder stocks soared in 2023, with notable gains in companies such as D.R. Horton (DHI), which is up 71%, Lennar (LEN) which is up 65%, and Beazer Homes (BZH) which is up 168%. Despite concerns about high interest rates and affordability, these companies have reported solid performances in the fourth quarter, expecting new order and delivery growth in the upcoming quarters. Other major players like Toll Brothers (TOL) also anticipate growth in 2024 and are strategically planning to expand communities and be prepared with inventory for the Spring selling season. Yahoo Finance's Jared Blikre breaks down this numbers—weighing in on what the industry can expect in 2024. For more Yahoo Finance housing coverage: 'Silver tsunami' to reshape the housing market: Meredith Whitney 2024 home b... |
50 Cheapest Places to Buy a House in Every StateIn this article, we will be covering the 50 cheapest places to buy a house in every state. If you wish to skip our detailed analysis, you can move directly to the 10 Cheapest Places to Buy a House in Every State. Housing Dynamics in the US The US housing market has long been subject […] |
Why the Market Dipped But Beazer Homes (BZH) Gained TodayIn the most recent trading session, Beazer Homes (BZH) closed at $33.02, indicating a +0.67% shift from the previous trading day. |
Beazer Homes (BZH) Stock Sinks As Market Gains: What You Should KnowIn the most recent trading session, Beazer Homes (BZH) closed at $31.10, indicating a -0.96% shift from the previous trading day. |
25 Cities Where Home Prices Are Rising Despite the High Mortgage RatesIn this article, we will be navigating through the housing market in the United States while covering the 25 cities where home prices are rising despite the high mortgage rates. If you wish to skip our detailed analysis, you can move directly to the 5 Cities Where Home Prices Are Rising Despite the High Mortgage […] |
BZH Price Returns
| 1-mo | 24.09% |
| 3-mo | 18.95% |
| 6-mo | 6.35% |
| 1-year | 21.99% |
| 3-year | 94.26% |
| 5-year | 198.94% |
| YTD | 0.15% |
| 2023 | 164.81% |
| 2022 | -45.05% |
| 2021 | 53.27% |
| 2020 | 7.22% |
| 2019 | 49.05% |
Continue Researching BZH
Here are a few links from around the web to help you further your research on Beazer Homes Usa Inc's stock as an investment opportunity:Beazer Homes Usa Inc (BZH) Stock Price | Nasdaq
Beazer Homes Usa Inc (BZH) Stock Quote, History and News - Yahoo Finance
Beazer Homes Usa Inc (BZH) Stock Price and Basic Information | MarketWatch
Loading social stream, please wait...