
Credit Acceptance Corporation (CACC): Price and Financial Metrics
CACC Price/Volume Stats
| Current price | $573.06 | 52-week high | $616.66 |
| Prev. close | $573.93 | 52-week low | $379.77 |
| Day low | $562.75 | Volume | 49,200 |
| Day high | $580.30 | Avg. volume | 59,264 |
| 50-day MA | $514.35 | Dividend yield | N/A |
| 200-day MA | $509.27 | Market Cap | 6.94B |
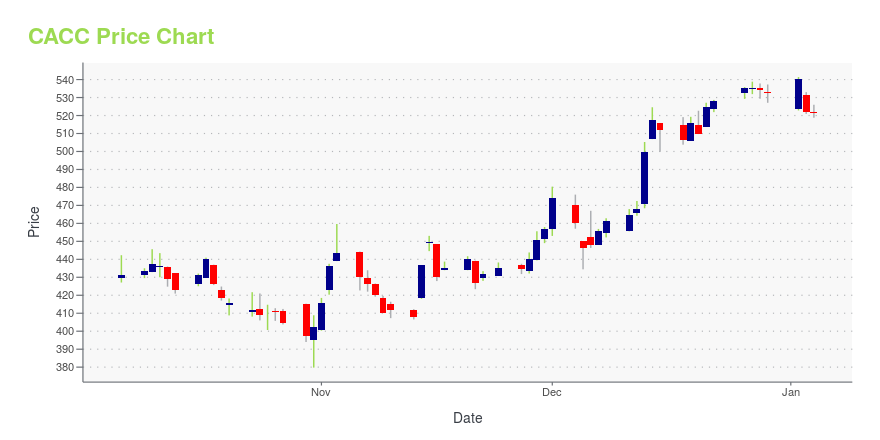
CACC Stock Price Chart Interactive Chart >
Credit Acceptance Corporation (CACC) Company Bio
Credit Acceptance Corporation provides automobile dealers financing programs, and related products and services that enable them to sell vehicles to consumers. The company was founded in 1972 and is based in Southfield, Michigan.
Latest CACC News From Around the Web
Below are the latest news stories about CREDIT ACCEPTANCE CORP that investors may wish to consider to help them evaluate CACC as an investment opportunity.
Credit Acceptance Announces Completion of $294.0 Million Asset-Backed FinancingSouthfield, Michigan , Dec. 21, 2023 (GLOBE NEWSWIRE) -- Credit Acceptance Corporation (Nasdaq: CACC) (the “Company”, “Credit Acceptance”, “we”, “our”, or “us”) announced today the completion of a $294.0 million asset-backed non-recourse secured financing (the “Financing”). Pursuant to this transaction, we conveyed loans having a value of approximately $375.1 million to a wholly-owned special purpose entity which will transfer the loans to a trust, which will issue three classes of notes: Note C |
Should You Invest in Credit Acceptance (CACC)?Investment management company Curreen Capital released its third quarter 2023 Investor letter. A copy of the same can be downloaded here. In the third quarter, the fund was down 0.95% compared to -3.27% for the S&P 500 Index. It had 40% of the fund in cash at the end of the quarter. In addition, you can […] |
Credit Acceptance Announces Closing of $600.0 Million Senior Notes Offering and Completion of Tender Offer for Senior Notes Due 2024Southfield, Michigan, Dec. 19, 2023 (GLOBE NEWSWIRE) -- Credit Acceptance Corporation (Nasdaq: CACC) (referred to as the “Company”, “Credit Acceptance”, “we”, “our”, or “us”) announced today the closing of the Company’s previously announced offering of $600.0 million aggregate principal amount of its 9.250% senior notes due 2028 (the “notes”) at an issue price of 100% of the principal amount of the notes in a private offering exempt from registration under the Securities Act of 1933, as amended |
Credit Acceptance Corporation Announces Expiration and Results of Tender Offer For Any and All of Its $400,000,000 Aggregate Principal Amount of 5.125% Senior Notes Due 2024Southfield, Michigan, Dec. 15, 2023 (GLOBE NEWSWIRE) -- Credit Acceptance Corporation (Nasdaq: CACC) (referred to as the “Company”, “Credit Acceptance”, “we”, “our”, or “us”) announced today that its previously announced cash tender offer (the “Offer”) for any and all of the $400,000,000 aggregate principal amount of its 5.125% Senior Notes due 2024 with CUSIP number 225310AN1 (the “Notes”) expired at 5:00 p.m., New York City time, on December 14, 2023 (the “Expiration Time”). According to infor |
Credit Acceptance Announces Pricing of $600.0 Million Senior Notes OfferingSouthfield, Michigan, Dec. 05, 2023 (GLOBE NEWSWIRE) -- Credit Acceptance Corporation (Nasdaq: CACC) (referred to as the “Company”, “Credit Acceptance”, “we”, “our”, or “us”) announced today that it priced $600.0 million aggregate principal amount of its 9.250% senior notes due 2028 (the “notes”) in its previously announced offering at an issue price of 100% of the principal amount of the notes. The $600.0 million aggregate principal amount of the notes represents an increase in the offering siz |
CACC Price Returns
| 1-mo | 15.55% |
| 3-mo | 8.82% |
| 6-mo | 2.77% |
| 1-year | 4.59% |
| 3-year | 21.26% |
| 5-year | 17.35% |
| YTD | 7.57% |
| 2023 | 12.30% |
| 2022 | -31.01% |
| 2021 | 98.67% |
| 2020 | -21.75% |
| 2019 | 15.87% |
Continue Researching CACC
Here are a few links from around the web to help you further your research on Credit Acceptance Corp's stock as an investment opportunity:Credit Acceptance Corp (CACC) Stock Price | Nasdaq
Credit Acceptance Corp (CACC) Stock Quote, History and News - Yahoo Finance
Credit Acceptance Corp (CACC) Stock Price and Basic Information | MarketWatch
Loading social stream, please wait...