
CACI International, Inc. (CACI): Price and Financial Metrics
CACI Price/Volume Stats
| Current price | $449.03 | 52-week high | $459.35 |
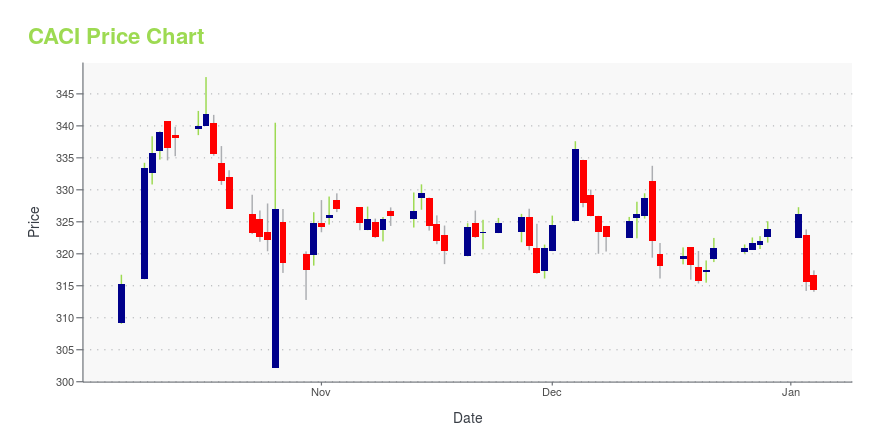
| Prev. close | $453.58 | 52-week low | $302.21 |
| Day low | $448.57 | Volume | 169,600 |
| Day high | $453.88 | Avg. volume | 116,604 |
| 50-day MA | $431.38 | Dividend yield | N/A |
| 200-day MA | $371.45 | Market Cap | 10.01B |
CACI Stock Price Chart Interactive Chart >
CACI International, Inc. (CACI) Company Bio
CACI International provides information solutions and services in support of national security missions and government transformation for Intelligence, Defense, and Federal Civilian customers. The company was founded in 1962 and is based in Arlington, Virginia.
Latest CACI News From Around the Web
Below are the latest news stories about CACI INTERNATIONAL INC that investors may wish to consider to help them evaluate CACI as an investment opportunity.
Employee Profile: Spotlighting Command Sgt. Maj. William F. Thetford, U.S. Army (Ret.)NORTHAMPTON, MA / ACCESSWIRE / December 21, 2023 / CACI Command Sgt. Maj. William F. Thetford, U.S. Army (Ret.) passionately strives to be the driving force behind mission success in all that he does. As a high-school student in 1980, Thetford recalls ... |
CACI International (CACI) Secures Multi-Year DIA ContractCACI International (CACI) inks a five-year deal with the DIA's NCMI to counter global health risks and safeguard US interests. |
CACI Awarded Task Order to Support Defense Intelligence Agency (DIA) National Center for Medical IntelligenceRESTON, Va., December 19, 2023--CACI International Inc (NYSE: CACI) announced today that it won a single-award, five-year task order to provide expertise to the Defense Intelligence Agency (DIA) National Center for Medical Intelligence (NCMI). This new contract with the Defense Medical Intelligence and Global Health Security (DMIGHS) includes enhanced activities assisting NCMI in effectively providing medical intelligence support on foreign health threats and other medical issues to protect U.S. |
12 Best Prison and Law Enforcement Stocks to Buy NowIn this article, we discuss the 12 best prison and law enforcement stocks to buy now. If you want to skip our detailed analysis of these stocks, go directly to 5 Best Prison And Law Enforcement Stocks To Buy Now. It is no secret that the United States has an inmate problem. There are more […] |
Investors Appear Satisfied With CACI International Inc's (NYSE:CACI) ProspectsThere wouldn't be many who think CACI International Inc's ( NYSE:CACI ) price-to-earnings (or "P/E") ratio of 18.6x is... |
CACI Price Returns
| 1-mo | 2.72% |
| 3-mo | 10.91% |
| 6-mo | 31.17% |
| 1-year | 30.01% |
| 3-year | 67.26% |
| 5-year | 106.62% |
| YTD | 38.65% |
| 2023 | 7.74% |
| 2022 | 11.66% |
| 2021 | 7.97% |
| 2020 | -0.26% |
| 2019 | 73.57% |
Continue Researching CACI
Want to do more research on Caci International Inc's stock and its price? Try the links below:Caci International Inc (CACI) Stock Price | Nasdaq
Caci International Inc (CACI) Stock Quote, History and News - Yahoo Finance
Caci International Inc (CACI) Stock Price and Basic Information | MarketWatch
Loading social stream, please wait...