
Calithera Biosciences, Inc. (CALA): Price and Financial Metrics
CALA Price/Volume Stats
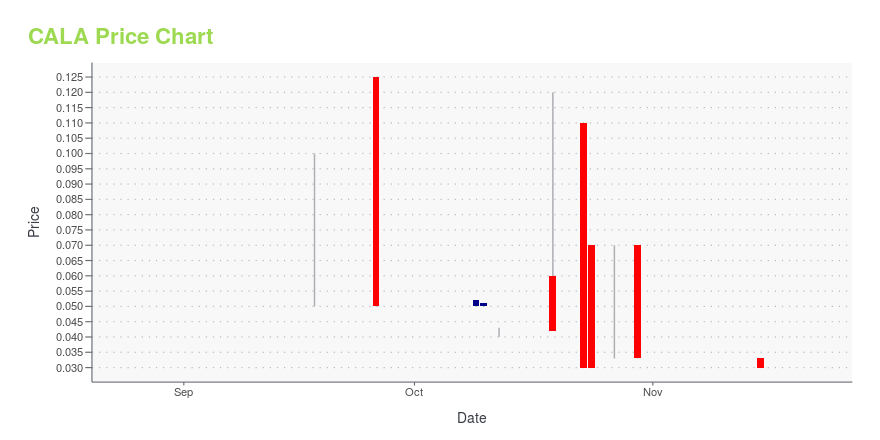
| Current price | $0.01 | 52-week high | $0.13 |
| Prev. close | $0.02 | 52-week low | $0.01 |
| Day low | $0.01 | Volume | 10,500 |
| Day high | $0.02 | Avg. volume | 5,405 |
| 50-day MA | $0.02 | Dividend yield | N/A |
| 200-day MA | $0.04 | Market Cap | 60.90K |
CALA Stock Price Chart Interactive Chart >
Calithera Biosciences, Inc. (CALA) Company Bio
Calithera Biosciences, Inc., a clinical-stage biopharmaceutical company, focuses on discovering and developing small molecule drugs directed against tumor metabolism and tumor immunology targets for the treatment of cancer in the United States. The company was founded in 2010 and is based in South San Francisco, California.
Latest CALA News From Around the Web
Below are the latest news stories about CALITHERA BIOSCIENCES INC that investors may wish to consider to help them evaluate CALA as an investment opportunity.
Calithera Biosciences Announces Update on Complete Liquidation and DissolutionSpecial Meeting to be Held on or about June 29, 2023 with a Record Date of May 25, 2023SOUTH SAN FRANCISCO, Calif., May 19, 2023 (GLOBE NEWSWIRE) -- Calithera Biosciences, Inc. (OTC: CALA) (the “Company”) announced that it intends to hold a special meeting of stockholders on or about June 29, 2023 (the “Special Meeting”), for the purpose of approving the Company’s Plan of Complete Liquidation and Dissolution (the “Plan of Dissolution”). In January 2023, the Company announced its intention to com |
Biotech company Calithera plans its own death. Will others follow?The Peninsula company's plan to close by the end of the first quarter is atypical in a biotech industry where executives try to keep their companies alive to the next milestone in order to raise more money. |
Calithera Biosciences Stock Nosedives On Complete Liquidation, DissolutionCalithera Biosciences Inc (NASDAQ: CALA) announced that its Board of Directors has determined that it is in the best interests of its shareholders to dissolve the company and liquidate its assets. To reduce costs and in connection with the planned dissolution, Calithera is discontinuing all clinical development programs and reducing its workforce, including the termination of most employees by the end of the first quarter. The company intends to call its shareholders for a special meeting in the |
Calithera Biosciences Announces Board Approval of Complete Liquidation and DissolutionSOUTH SAN FRANCISCO, Calif., Jan. 09, 2023 (GLOBE NEWSWIRE) -- Calithera Biosciences, Inc. (Nasdaq: CALA), today announced that its Board of Directors has determined, after extensive consideration of potential strategic alternatives, that it is in the best interests of its shareholders to dissolve the Company and liquidate its assets, following an orderly wind down of the company’s operations. In order to reduce costs and in connection with the planned dissolution, Calithera is discontinuing all |
CALA Price Returns
| 1-mo | 0.00% |
| 3-mo | -50.00% |
| 6-mo | N/A |
| 1-year | -87.80% |
| 3-year | -99.97% |
| 5-year | -99.99% |
| YTD | -66.67% |
| 2023 | -99.08% |
| 2022 | -75.50% |
| 2021 | -86.45% |
| 2020 | -14.01% |
| 2019 | 42.39% |
Loading social stream, please wait...