Capricor Therapeutics, Inc. (CAPR): Price and Financial Metrics
GET POWR RATINGS... FREE!
CAPR POWR Grades
- CAPR scores best on the Sentiment dimension, with a Sentiment rank ahead of 69.74% of US stocks.
- The strongest trend for CAPR is in Value, which has been heading down over the past 179 days.
- CAPR ranks lowest in Momentum; there it ranks in the 8th percentile.
CAPR Stock Summary
- Capricor Therapeutics Inc's capital turnover -- a measure of revenue relative to shareholder's equity -- is better than merely 6.73% of US listed stocks.
- CAPR's price/sales ratio is 338.33; that's higher than the P/S ratio of 98.91% of US stocks.
- With a year-over-year growth in debt of 802.17%, Capricor Therapeutics Inc's debt growth rate surpasses 98.18% of about US stocks.
- Stocks that are quantitatively similar to CAPR, based on their financial statements, market capitalization, and price volatility, are STRO, YMAB, BCDA, ASND, and TARS.
- Visit CAPR's SEC page to see the company's official filings. To visit the company's web site, go to www.capricor.com.
CAPR Valuation Summary
- CAPR's price/earnings ratio is -6.4; this is 117.53% lower than that of the median Healthcare stock.
- CAPR's price/earnings ratio has moved up 5.7 over the prior 174 months.
- CAPR's EV/EBIT ratio has moved up 8.9 over the prior 174 months.
Below are key valuation metrics over time for CAPR.
Stock | Date | P/S | P/B | P/E | EV/EBIT |
---|---|---|---|---|---|
CAPR | 2021-08-31 | 360.3 | 3.5 | -6.4 | -4.3 |
CAPR | 2021-08-30 | 310.9 | 3.0 | -5.5 | -3.4 |
CAPR | 2021-08-27 | 301.6 | 2.9 | -5.4 | -3.2 |
CAPR | 2021-08-26 | 303.7 | 2.9 | -5.4 | -3.3 |
CAPR | 2021-08-25 | 307.8 | 3.0 | -5.5 | -3.4 |
CAPR | 2021-08-24 | 296.6 | 2.8 | -5.3 | -3.2 |
CAPR Growth Metrics
- The 4 year cash and equivalents growth rate now stands at 12.33%.
- Its 5 year cash and equivalents growth rate is now at 12.33%.
- The 3 year net cashflow from operations growth rate now stands at 6.91%.

The table below shows CAPR's growth in key financial areas (numbers in millions of US dollars).
Date | Revenue | Operating Cash Flow | Net Income to Common Stock |
---|---|---|---|
2021-12-31 | 0.244898 | -16.80932 | -20.02252 |
2021-09-30 | 0.302728 | -15.02414 | -18.00993 |
2021-06-30 | 0.319591 | -14.66378 | -17.98824 |
2021-03-31 | 0.165373 | -12.16602 | -16.72413 |
2020-12-31 | 0.31025 | -10.05481 | -13.65703 |
2020-09-30 | 0.47452 | -7.997445 | -10.94851 |
CAPR's Quality Factors
The “Quality” component of the POWR Ratings focuses on 31 different factors of a companies fundamentals and operational strength. Here are some key insights as we drill into the specifics of these quality attributes.- CAPR has a Quality Grade of D, ranking ahead of 11.34% of graded US stocks.
- CAPR's asset turnover comes in at 0.008 -- ranking 401st of 682 Pharmaceutical Products stocks.
- DRNA, MYMD, and PCRX are the stocks whose asset turnover ratios are most correlated with CAPR.
The table below shows CAPR's key quality metrics over time.
Period | Asset Turnover | Gross Margin | ROIC |
---|---|---|---|
2021-06-30 | 0.008 | 1 | 14.774 |
2021-03-31 | 0.004 | 1 | 15.634 |
2020-12-31 | 0.010 | 1 | 19.771 |
2020-09-30 | 0.019 | 1 | -10.307 |
2020-06-30 | 0.034 | 1 | -6.657 |
2020-03-31 | 0.095 | 1 | -5.229 |
CAPR Price Target
For more insight on analysts targets of CAPR, see our CAPR price target page. And for a list of of all stocks sorted by upside potential based on analyst target price, see our Top Price Target page.
Average Price Target | $10.50 | Average Broker Recommendation | 1.5 (Moderate Buy) |
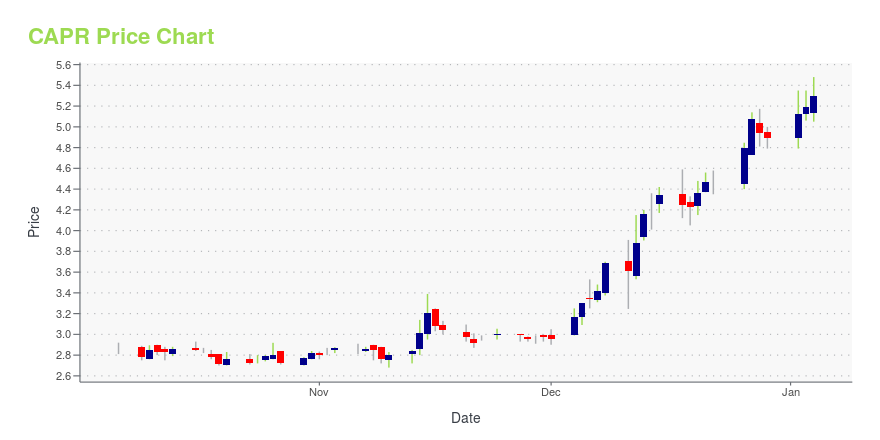
CAPR Stock Price Chart Interactive Chart >
CAPR Price/Volume Stats
Current price | $3.64 | 52-week high | $6.22 |
Prev. close | $3.47 | 52-week low | $2.56 |
Day low | $3.46 | Volume | 125,200 |
Day high | $3.66 | Avg. volume | 278,482 |
50-day MA | $3.57 | Dividend yield | N/A |
200-day MA | $3.78 | Market Cap | 88.54M |
Capricor Therapeutics, Inc. (CAPR) Company Bio
Capricor Therapeutics, Inc., a biotechnology company, focuses on the discovery, development, and commercialization of novel therapeutics primarily for the treatment of cardiovascular diseases. The company was founded in 2005 and is based in Beverly Hills, California.
Latest CAPR News From Around the Web
Below are the latest news stories about Capricor Therapeutics Inc that investors may wish to consider to help them evaluate CAPR as an investment opportunity.
We're Not Very Worried About Capricor Therapeutics' (NASDAQ:CAPR) Cash Burn RateWe can readily understand why investors are attracted to unprofitable companies. For example, although... |
Thinking about buying stock in SoFi Technologies, Vinco Ventures, DiDi Global, Capricor Therapeutics, or ShiftPixy?NEW YORK , Jan. 25, 2022 /PRNewswire/ -- InvestorsObserver issues critical PriceWatch Alerts for SOFI, BBIG, DIDI, CAPR, and PIXY. … Full story available on Benzinga.com |
Capricor jumps 12% after CAP-1002 commercialization deal in U.S. for treatment of DMDCapricor Therapeutics (CAPR) soars 12.4% premarket after entering into a partnership with Nippon Shinyaku Co., Ltd., a Japanese pharmaceutical company, for the exclusive |
Nippon Shinyaku and Capricor Therapeutics Enter into an Exclusive Partnership for Commercialization and Distribution of CAP-1002 for the Treatment* of Duchenne Muscular Dystrophy in US*NS Pharma Note: CAP-1002 is an investigational therapy and not approved in the US. |
Capricor Therapeutics, Nippon Shinyaku Ink US Pact For Duchenne Muscular Dystrophy CandidateCapricor Therapeutics Inc (NASDAQ: CAPR) has partnered with Nippon Shinyaku Co Ltd for the exclusive commercialization and distribution in the U.S of Capricor's CAP-1002 for Duchenne muscular dystrophy (DMD). Capricor's proprietary cell therapy, CAP-1002, comprises human allogeneic cardiosphere-derived cells. HOPE-Duchenne and HOPE-2, the Phase 1 and Phase 2 clinical trials of CAP-1002, showed statistically significant improvements in upper limb and/or cardiac function in the treatment groups. H |
CAPR Price Returns
1-mo | 14.83% |
3-mo | -10.12% |
6-mo | 8.01% |
1-year | -3.96% |
3-year | 6.12% |
5-year | -56.14% |
YTD | 24.23% |
2021 | -14.58% |
2020 | 167.97% |
2019 | -68.78% |
2018 | -74.05% |
2017 | -40.60% |
Continue Researching CAPR
Want to do more research on Capricor Therapeutics Inc's stock and its price? Try the links below:Capricor Therapeutics Inc (CAPR) Stock Price | Nasdaq
Capricor Therapeutics Inc (CAPR) Stock Quote, History and News - Yahoo Finance
Capricor Therapeutics Inc (CAPR) Stock Price and Basic Information | MarketWatch
Loading social stream, please wait...