Caseys General Stores, Inc. (CASY): Price and Financial Metrics
GET POWR RATINGS... FREE!
CASY POWR Grades
- CASY scores best on the Quality dimension, with a Quality rank ahead of 86.14% of US stocks.
- CASY's strongest trending metric is Stability; it's been moving down over the last 177 days.
- CASY ranks lowest in Momentum; there it ranks in the 43rd percentile.
CASY Stock Summary
- CASEYS GENERAL STORES INC's capital turnover -- a measure of revenue relative to shareholder's equity -- is better than 92.66% of US listed stocks.
- CASEYS GENERAL STORES INC's stock had its IPO on January 1, 1986, making it an older stock than 93.5% of US equities in our set.
- In terms of volatility of its share price, CASY is more volatile than just 12.48% of stocks we're observing.
- If you're looking for stocks that are quantitatively similar to CASEYS GENERAL STORES INC, a group of peers worth examining would be UNVR, AMN, DDS, BCC, and IBP.
- CASY's SEC filings can be seen here. And to visit CASEYS GENERAL STORES INC's official web site, go to www.caseys.com.
CASY Valuation Summary
- In comparison to the median Consumer Defensive stock, CASY's price/sales ratio is 50% lower, now standing at 0.5.
- Over the past 243 months, CASY's price/earnings ratio has gone up 1.3.
Below are key valuation metrics over time for CASY.
Stock | Date | P/S | P/B | P/E | EV/EBIT |
---|---|---|---|---|---|
CASY | 2023-03-24 | 0.5 | 3.0 | 17.3 | 14.1 |
CASY | 2023-03-23 | 0.5 | 3.0 | 17.1 | 14.0 |
CASY | 2023-03-22 | 0.5 | 3.0 | 17.3 | 14.1 |
CASY | 2023-03-21 | 0.5 | 3.0 | 17.4 | 14.1 |
CASY | 2023-03-20 | 0.5 | 3.0 | 17.2 | 14.0 |
CASY | 2023-03-17 | 0.5 | 2.9 | 17.0 | 13.9 |
CASY Growth Metrics
- Its 4 year net cashflow from operations growth rate is now at 9.81%.
- The 3 year revenue growth rate now stands at 38.49%.
- Its 3 year net income to common stockholders growth rate is now at 66.66%.

The table below shows CASY's growth in key financial areas (numbers in millions of US dollars).
Date | Revenue | Operating Cash Flow | Net Income to Common Stock |
---|---|---|---|
2022-09-30 | 14,940.88 | 819.463 | 414.287 |
2022-06-30 | 14,225.25 | 823.388 | 373.563 |
2022-03-31 | 12,952.59 | 788.741 | 339.79 |
2021-12-31 | 11,871.89 | 677.55 | 321.712 |
2021-09-30 | 10,831.2 | 707.508 | 296.315 |
2021-06-30 | 9,784.162 | 693.597 | 311.467 |
CASY's Quality Factors
The “Quality” component of the POWR Ratings focuses on 31 different factors of a companies fundamentals and operational strength. Here are some key insights as we drill into the specifics of these quality attributes.- CASY has a Quality Grade of B, ranking ahead of 75.77% of graded US stocks.
- CASY's asset turnover comes in at 2.144 -- ranking 42nd of 165 Retail stocks.
- SGU, SBH, and BNED are the stocks whose asset turnover ratios are most correlated with CASY.
The table below shows CASY's key quality metrics over time.
Period | Asset Turnover | Gross Margin | ROIC |
---|---|---|---|
2021-07-31 | 2.144 | 0.251 | 0.094 |
2021-04-30 | 2.016 | 0.271 | 0.099 |
2021-01-31 | 1.943 | 0.285 | 0.109 |
2020-10-31 | 2.058 | 0.272 | 0.112 |
2020-07-31 | 2.187 | 0.255 | 0.108 |
2020-04-30 | 2.357 | 0.234 | 0.097 |
CASY Price Target
For more insight on analysts targets of CASY, see our CASY price target page. And for a list of of all stocks sorted by upside potential based on analyst target price, see our Top Price Target page.
Average Price Target | $231.36 | Average Broker Recommendation | 1.62 (Moderate Buy) |
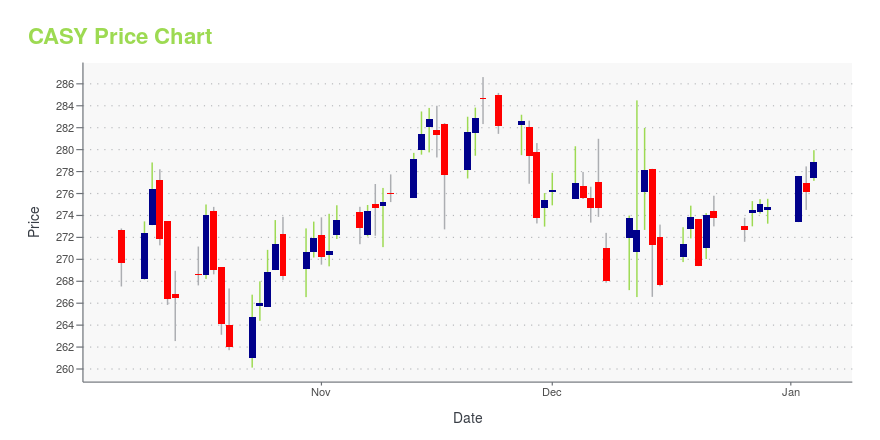
CASY Stock Price Chart Interactive Chart >
CASY Price/Volume Stats
Current price | $213.62 | 52-week high | $249.90 |
Prev. close | $213.75 | 52-week low | $181.40 |
Day low | $212.99 | Volume | 52,400 |
Day high | $215.47 | Avg. volume | 253,701 |
50-day MA | $217.81 | Dividend yield | 0.71% |
200-day MA | $215.97 | Market Cap | 7.96B |
Caseys General Stores, Inc. (CASY) Company Bio
Casey's General Stores operates convenience stores in the Midwest, offering a selection of food, including freshly prepared foods, beverage and tobacco products, health and beauty aids, automotive products, as well as gasoline. The company was founded in 1959 and is based in Ankeny, Iowa.
Latest CASY News From Around the Web
Below are the latest news stories about CASEYS GENERAL STORES INC that investors may wish to consider to help them evaluate CASY as an investment opportunity.
One Casey's General Stores, Inc. (NASDAQ:CASY) insider upped their stake in the previous yearViewing insider transactions for Casey's General Stores, Inc.'s ( NASDAQ:CASY ) over the last year, we see that... |
10 High Growth Retail Stocks That Are ProfitableIn this article, we will discuss the 10 high growth retail stocks that are profitable. You can skip our industry overview and go directly to the 5 High Growth Retail Stocks That Are Profitable. The global surge in inflation rates has resulted in reduced consumer spending growth in real terms, creating a challenging economic landscape […] |
4 Stocks to Buy as E-Commerce Sales Continue to SoarStocks with a strong online presence like American Eagle Outfitters, Inc. (AEO), Casey's General Stores, Inc. (CASY), DICK'S Sporting Goods, Inc. (DKS) and General Mills, Inc. (GIS) are likely to benefit in the near term. |
2 Dividend Stocks That Could Help Recession-Proof Your PortfolioIn a period of market turmoil, dividend stocks can often provide stability to a portfolio with the consistent payouts to shareholders and historically less volatile stock prices. Beyond the general dependability of dividend-paying stocks, companies with a history of increasing their dividends have historically outperformed the overall stock market. With that in mind, here are three dividend stocks that could help recession-proof your portfolio. |
4 Solid Stocks to Buy on Continued Growth in Retail SalesRetail stocks like Urban Outfitters, Inc. (URBN), Tapestry, Inc. (TPR), Casey's General Stores, Inc. (CASY) and DICK'S Sporting Goods, Inc. (DKS) are poised to do well in the near term. |
CASY Price Returns
1-mo | 2.73% |
3-mo | -4.63% |
6-mo | 5.83% |
1-year | 7.78% |
3-year | 64.32% |
5-year | 102.44% |
YTD | -4.63% |
2022 | 14.49% |
2021 | 11.25% |
2020 | 13.24% |
2019 | 25.12% |
2018 | 15.59% |
CASY Dividends
Ex-Dividend Date | Type | Payout Amount | Change | ||||||
---|---|---|---|---|---|---|---|---|---|
Loading, please wait... |
Continue Researching CASY
Here are a few links from around the web to help you further your research on Caseys General Stores Inc's stock as an investment opportunity:Caseys General Stores Inc (CASY) Stock Price | Nasdaq
Caseys General Stores Inc (CASY) Stock Quote, History and News - Yahoo Finance
Caseys General Stores Inc (CASY) Stock Price and Basic Information | MarketWatch
Loading social stream, please wait...