CBAK Energy Technology Inc. (CBAT): Price and Financial Metrics
GET POWR RATINGS... FREE!
CBAT POWR Grades
- CBAT scores best on the Value dimension, with a Value rank ahead of 98.62% of US stocks.
- CBAT's strongest trending metric is Growth; it's been moving down over the last 177 days.
- CBAT ranks lowest in Quality; there it ranks in the 7th percentile.
CBAT Stock Summary
- With a price/sales ratio of 0.32, CBAK ENERGY TECHNOLOGY INC has a higher such ratio than just 11.6% of stocks in our set.
- With a year-over-year growth in debt of 913.53%, CBAK ENERGY TECHNOLOGY INC's debt growth rate surpasses 97.97% of about US stocks.
- As for revenue growth, note that CBAT's revenue has grown 451.22% over the past 12 months; that beats the revenue growth of 98.15% of US companies in our set.
- Stocks with similar financial metrics, market capitalization, and price volatility to CBAK ENERGY TECHNOLOGY INC are SIGA, SPNS, ACLS, GTEC, and BJDX.
- CBAT's SEC filings can be seen here. And to visit CBAK ENERGY TECHNOLOGY INC's official web site, go to www.cbak.com.cn.
CBAT Valuation Summary
- CBAT's price/sales ratio is 0.4; this is 63.64% lower than that of the median Industrials stock.
- CBAT's EV/EBIT ratio has moved up 15.6 over the prior 216 months.
Below are key valuation metrics over time for CBAT.
Stock | Date | P/S | P/B | P/E | EV/EBIT |
---|---|---|---|---|---|
CBAT | 2023-03-17 | 0.4 | 0.7 | 8.0 | 48.9 |
CBAT | 2023-03-16 | 0.4 | 0.7 | 8.3 | 50.6 |
CBAT | 2023-03-15 | 0.4 | 0.7 | 8.3 | 50.6 |
CBAT | 2023-03-14 | 0.4 | 0.7 | 8.3 | 50.5 |
CBAT | 2023-03-13 | 0.4 | 0.7 | 8.4 | 51.3 |
CBAT | 2023-03-10 | 0.4 | 0.7 | 8.5 | 51.4 |
CBAT Growth Metrics
- Its 2 year price growth rate is now at 31.09%.
- Its 4 year cash and equivalents growth rate is now at -61.25%.
- Its 5 year net income to common stockholders growth rate is now at 19.71%.

The table below shows CBAT's growth in key financial areas (numbers in millions of US dollars).
Date | Revenue | Operating Cash Flow | Net Income to Common Stock |
---|---|---|---|
2022-09-30 | 222.07 | 19.66447 | 10.40579 |
2022-06-30 | 173.9105 | 15.49301 | 30.42581 |
2022-03-31 | 123.45 | 0.017188 | 32.32122 |
2021-12-31 | 52.66973 | -4.270056 | 61.48605 |
2021-09-30 | 40.28737 | -17.23652 | 48.03567 |
2021-06-30 | 41.34583 | -9.503298 | 28.06018 |
CBAT's Quality Factors
The “Quality” component of the POWR Ratings focuses on 31 different factors of a companies fundamentals and operational strength. Here are some key insights as we drill into the specifics of these quality attributes.- CBAT has a Quality Grade of D, ranking ahead of 8.11% of graded US stocks.
- CBAT's asset turnover comes in at 0.258 -- ranking 37th of 53 Electrical Equipment stocks.
- POWL, ULBI, and ENR are the stocks whose asset turnover ratios are most correlated with CBAT.
The table below shows CBAT's key quality metrics over time.
Period | Asset Turnover | Gross Margin | ROIC |
---|---|---|---|
2021-06-30 | 0.258 | 0.130 | 0.396 |
2021-03-31 | 0.296 | 0.108 | 0.385 |
2020-12-31 | 0.348 | 0.072 | -0.097 |
2020-09-30 | 0.279 | 0.078 | -0.090 |
2020-06-30 | 0.247 | 0.056 | -0.118 |
2020-03-31 | 0.229 | 0.044 | -0.134 |
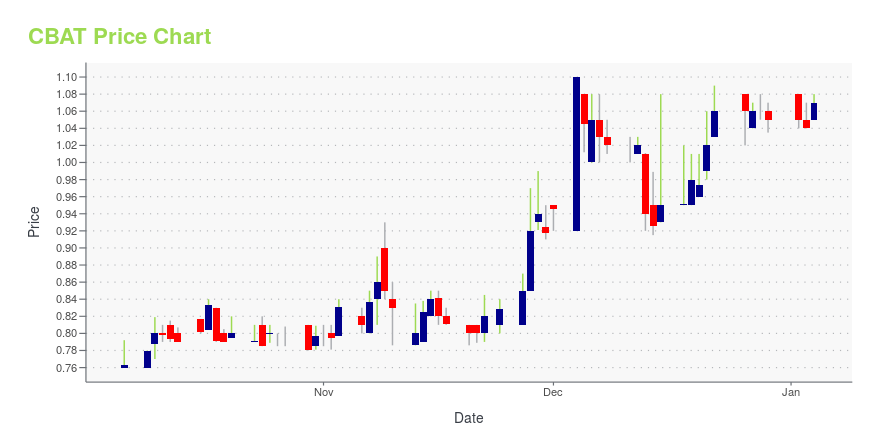
CBAT Stock Price Chart Interactive Chart >
CBAT Price/Volume Stats
Current price | $0.87 | 52-week high | $1.70 |
Prev. close | $0.88 | 52-week low | $0.80 |
Day low | $0.87 | Volume | 110,300 |
Day high | $0.89 | Avg. volume | 148,975 |
50-day MA | $1.04 | Dividend yield | N/A |
200-day MA | $1.16 | Market Cap | 77.74M |
CBAK Energy Technology Inc. (CBAT) Company Bio
CBAK Energy Technology, Inc. engages in the development, manufacture, and sale. of lithium ion rechargeable batteries. It offers aluminum-case cell, battery pack, cylindrical cell, lithium polymer cell, and high-power lithium battery cell. Its products are used for electronic vehicles; light electric vehicles; and electric tools, energy storage, uninterruptible power supply, and other high power applications. The company was founded in August 2001 and is headquartered in Dalian, China.
Latest CBAT News From Around the Web
Below are the latest news stories about CBAK ENERGY TECHNOLOGY INC that investors may wish to consider to help them evaluate CBAT as an investment opportunity.
10 Most Volatile Stocks Under $5 For Day TradingIn this article we present the list of the 10 Most Volatile Stocks Under $5 For Day Trading. Click to skip ahead and see the 5 Most Volatile Stocks Under $5 For Day Trading. Braemar Hotels & Resorts Inc. (NYSE:BHR), Alto Ingredients, Inc. (NASDAQ:ALTO), and Pitney Bowes Inc. (NYSE:PBI) are a few of the most volatile […] |
7 Cheap Lithium Stocks to Buy for Big UpsideInvestors seeking cheap lithium stocks to buy should consider these key EV industry suppliers and more diverse plays. |
CBAK Energy Reports Third Quarter 2022 Unaudited Financial ResultsCBAK Energy Technology, Inc. (NASDAQ: CBAT) ("CBAK Energy," or the "Company") a leading lithium-ion battery manufacturer and electric energy solution provider in China, today reported its unaudited financial results for the third quarter of 2022 ended September 30, 2022. |
CBAK Energy to Report Third Quarter 2022 Unaudited Financial Results on Monday, November 14, 2022CBAK Energy Technology, Inc. (NASDAQ: CBAT) ("CBAK Energy", or the "Company"), a leading lithium-ion battery manufacturer and electric energy solution provider in China, today announced that it will report its unaudited financial results for the third quarter ended September 30, 2022 on Monday, November 14, 2022, before the U.S. market opens. |
7 Best Green Penny Stocks to Buy NowEven the best green penny stocks are speculative investments. In fact, all penny stocks are in the latter category. However, the appeal of their speculative nature is their higher potential return. On the other hand, of course, investors can lose a great deal of their money by betting on penny stocks. So anyone considering purchasing penny stocks, green or otherwise, should take that into account. That said, there are reasons to believe that the best green penny stocks have better chances of gen |
CBAT Price Returns
1-mo | -13.00% |
3-mo | -12.12% |
6-mo | -24.35% |
1-year | -32.03% |
3-year | 107.14% |
5-year | -35.56% |
YTD | -12.12% |
2022 | -36.54% |
2021 | -69.17% |
2020 | 340.00% |
2019 | 202.63% |
2018 | -74.24% |
Continue Researching CBAT
Want to see what other sources are saying about CBAK Energy Technology Inc's financials and stock price? Try the links below:CBAK Energy Technology Inc (CBAT) Stock Price | Nasdaq
CBAK Energy Technology Inc (CBAT) Stock Quote, History and News - Yahoo Finance
CBAK Energy Technology Inc (CBAT) Stock Price and Basic Information | MarketWatch
Loading social stream, please wait...