Catalyst Biosciences, Inc. (CBIO): Price and Financial Metrics
GET POWR RATINGS... FREE!
CBIO POWR Grades
- CBIO scores best on the Value dimension, with a Value rank ahead of 88.68% of US stocks.
- CBIO's strongest trending metric is Value; it's been moving up over the last 120 days.
- CBIO's current lowest rank is in the Stability metric (where it is better than 3.28% of US stocks).
CBIO Stock Summary
- With a price/earnings ratio of 0.81, CATALYST BIOSCIENCES INC P/E ratio is greater than that of about only 0.41% of stocks in our set with positive earnings.
- Of note is the ratio of CATALYST BIOSCIENCES INC's sales and general administrative expense to its total operating expenses; merely 0.07% of US stocks have a lower such ratio.
- The ratio of debt to operating expenses for CATALYST BIOSCIENCES INC is higher than it is for about only 0.42% of US stocks.
- Stocks that are quantitatively similar to CBIO, based on their financial statements, market capitalization, and price volatility, are HBM, CGAU, INVA, ASPS, and AEHL.
- CBIO's SEC filings can be seen here. And to visit CATALYST BIOSCIENCES INC's official web site, go to www.catalystbiosciences.com.
CBIO Valuation Summary
- CBIO's price/earnings ratio is 0.7; this is 96.92% lower than that of the median Healthcare stock.
- CBIO's price/sales ratio has moved down 137.6 over the prior 204 months.
Below are key valuation metrics over time for CBIO.
Stock | Date | P/S | P/B | P/E | EV/EBIT |
---|---|---|---|---|---|
CBIO | 2023-01-20 | 2.6 | 0.3 | 0.7 | -1.2 |
CBIO | 2023-01-19 | 2.4 | 0.3 | 0.7 | -1.2 |
CBIO | 2023-01-18 | 2.4 | 0.3 | 0.7 | -1.2 |
CBIO | 2023-01-17 | 2.5 | 0.3 | 0.7 | -1.2 |
CBIO | 2023-01-13 | 2.6 | 0.3 | 0.7 | -1.2 |
CBIO | 2023-01-12 | 6.1 | 0.7 | 1.7 | -0.2 |
CBIO Growth Metrics
- The 2 year net cashflow from operations growth rate now stands at -113.63%.
- The 3 year net cashflow from operations growth rate now stands at -86.05%.
- The 4 year net cashflow from operations growth rate now stands at -85.6%.

The table below shows CBIO's growth in key financial areas (numbers in millions of US dollars).
Date | Revenue | Operating Cash Flow | Net Income to Common Stock |
---|---|---|---|
2022-09-30 | 3.234 | -49.297 | 11.883 |
2022-06-30 | 5.533 | -63.62 | -8.471 |
2022-03-31 | 6.665 | -71.449 | -80.031 |
2021-12-31 | 7.338 | -83.755 | -87.933 |
2021-09-30 | 6.929 | -88.193 | -86.511 |
2021-06-30 | 5.523 | -79.601 | -77.306 |
CBIO's Quality Factors
The “Quality” component of the POWR Ratings focuses on 31 different factors of a companies fundamentals and operational strength. Here are some key insights as we drill into the specifics of these quality attributes.- CBIO has a Quality Grade of F, ranking ahead of 3.39% of graded US stocks.
- CBIO's asset turnover comes in at 0.052 -- ranking 319th of 680 Pharmaceutical Products stocks.
- LIFE, GLYC, and CLSD are the stocks whose asset turnover ratios are most correlated with CBIO.
The table below shows CBIO's key quality metrics over time.
Period | Asset Turnover | Gross Margin | ROIC |
---|---|---|---|
2021-06-30 | 0.052 | -0.007 | -1.949 |
2021-03-31 | 0.054 | -0.019 | -1.527 |
2020-12-31 | 0.190 | 0.563 | -1.113 |
2020-09-30 | 0.170 | 0.623 | -0.971 |
2020-06-30 | 0.170 | 0.655 | -0.952 |
2020-03-31 | 0.163 | 0.726 | -0.778 |
CBIO Price Target
For more insight on analysts targets of CBIO, see our CBIO price target page. And for a list of of all stocks sorted by upside potential based on analyst target price, see our Top Price Target page.
Average Price Target | $16.60 | Average Broker Recommendation | 1.5 (Moderate Buy) |
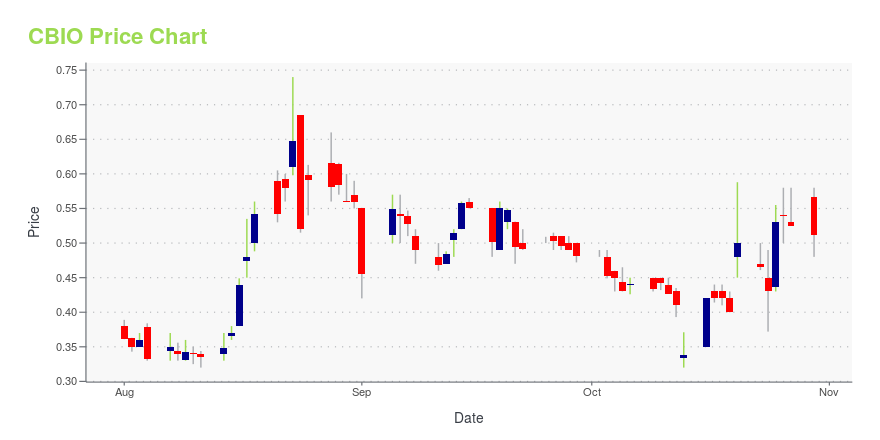
CBIO Stock Price Chart Interactive Chart >
CBIO Price/Volume Stats
Current price | $0.30 | 52-week high | $2.09 |
Prev. close | $0.30 | 52-week low | $0.20 |
Day low | $0.29 | Volume | 577,959 |
Day high | $0.32 | Avg. volume | 1,942,739 |
50-day MA | $0.49 | Dividend yield | N/A |
200-day MA | $1.00 | Market Cap | 9.29M |
Catalyst Biosciences, Inc. (CBIO) Company Bio
Catalyst Biosciences, Inc., a clinical-stage biopharmaceutical company, focuses on engineering proteases as therapeutics for hemophilia, hemeostasis, complement-mediated diseases, and other unmet medical needs. The company is based in South San Francisco, California.
Latest CBIO News From Around the Web
Below are the latest news stories about CATALYST BIOSCIENCES INC that investors may wish to consider to help them evaluate CBIO as an investment opportunity.
Today’s Biggest Pre-Market Stock Movers: 10 Top Gainers and Losers on FridayWe're starting the final day of trading this week with a breakdown of the biggest pre-market stock movers for Friday morning! |
Catalyst Biosciences Completes First Steps in Reverse Merger PlanAcquires F351, a Phase 3 Drug to Treat Fibrosis Will Acquire Controlling Interest in Continent, a China-Based Commercial Pharma Company, from the GNI Group in Subsequent Transaction Announces $7.5 Million Special Dividend and Contingent Value Right (CVR) CBIO Stockholder Meeting Planned for 2023 CBIO to Host Conference Call Today at 8:00 a.m. E.T. SOUTH SAN FRANCISCO, Calif. and TOKYO, Dec. 27, 2022 (GLOBE NEWSWIRE) -- Catalyst Biosciences, Inc. (NASDAQ: CBIO) (“Catalyst”) and GNI Group Ltd. (21 |
Catalyst Biosciences Third Quarter 2022 Earnings: US$0.15 loss per share (vs US$0.80 loss in 3Q 2021)Catalyst Biosciences ( NASDAQ:CBIO ) Third Quarter 2022 Results Key Financial Results Net loss: US$4.88m (loss narrowed... |
Today’s Biggest Pre-Market Stock Movers: 10 Top Gainers and Losers on WednesdayWe're starting Wednesday with an overview of the biggest pre-market stock movers this morning and the news moving those shares! |
Bullish insiders at Catalyst Biosciences, Inc. (NASDAQ:CBIO) loaded up on US$1.2m of stock earlier this yearOver the last year, a good number of insiders have significantly increased their holdings in Catalyst Biosciences, Inc... |
CBIO Price Returns
1-mo | -42.31% |
3-mo | -48.35% |
6-mo | -82.86% |
1-year | -45.46% |
3-year | -95.52% |
5-year | -98.79% |
YTD | -43.13% |
2022 | -42.29% |
2021 | -85.52% |
2020 | -7.34% |
2019 | -13.69% |
2018 | -42.16% |
Loading social stream, please wait...