Cabot Corporation (CBT): Price and Financial Metrics
CBT Price/Volume Stats
Current price | $77.11 | 52-week high | $83.74 |
Prev. close | $76.06 | 52-week low | $63.73 |
Day low | $76.64 | Volume | 332,345 |
Day high | $78.06 | Avg. volume | 296,507 |
50-day MA | $71.42 | Dividend yield | 2.06% |
200-day MA | $71.53 | Market Cap | 4.26B |
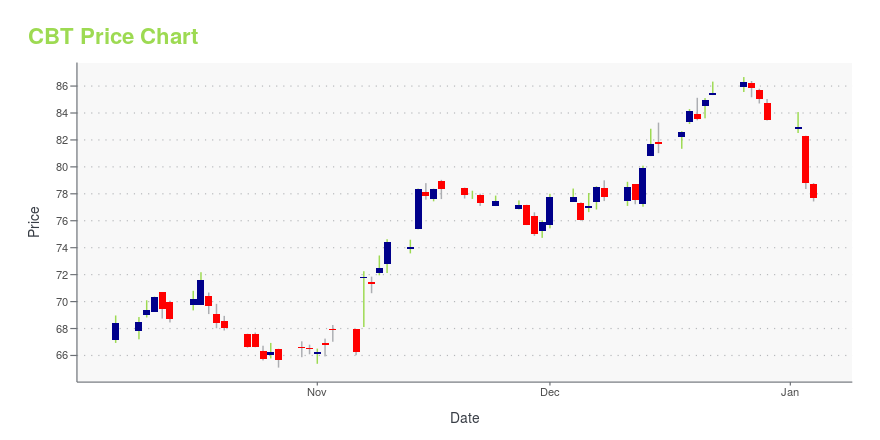
CBT Stock Price Chart Interactive Chart >
CBT POWR Grades
- CBT scores best on the Quality dimension, with a Quality rank ahead of 84.47% of US stocks.
- CBT's strongest trending metric is Sentiment; it's been moving up over the last 177 days.
- CBT's current lowest rank is in the Momentum metric (where it is better than 21.15% of US stocks).
CBT Stock Summary
- CABOT CORP's capital turnover -- a measure of revenue relative to shareholder's equity -- is better than 82.66% of US listed stocks.
- CBT's went public 37.95 years ago, making it older than 93.02% of listed US stocks we're tracking.
- In terms of volatility of its share price, CBT is more volatile than only 6.23% of stocks we're observing.
- Stocks that are quantitatively similar to CBT, based on their financial statements, market capitalization, and price volatility, are VNT, BC, KODK, MOG.A, and BDC.
- CBT's SEC filings can be seen here. And to visit CABOT CORP's official web site, go to www.cabotcorp.com.
CBT Valuation Summary
- CBT's EV/EBIT ratio is 10.2; this is 18.4% lower than that of the median Basic Materials stock.
- CBT's price/earnings ratio has moved down 17.6 over the prior 243 months.
Below are key valuation metrics over time for CBT.
Stock | Date | P/S | P/B | P/E | EV/EBIT |
---|---|---|---|---|---|
CBT | 2023-11-29 | 1.1 | 3.3 | 9.3 | 10.2 |
CBT | 2023-11-28 | 1.1 | 3.3 | 9.4 | 10.3 |
CBT | 2023-11-27 | 1.1 | 3.4 | 9.6 | 10.5 |
CBT | 2023-11-24 | 1.1 | 3.4 | 9.6 | 10.5 |
CBT | 2023-11-22 | 1.1 | 3.4 | 9.6 | 10.5 |
CBT | 2023-11-21 | 1.1 | 3.8 | 14.3 | 10.5 |
CBT Growth Metrics
- The 2 year cash and equivalents growth rate now stands at 51.41%.
- Its 4 year revenue growth rate is now at 22.93%.
- The year over year price growth rate now stands at 7.88%.

The table below shows CBT's growth in key financial areas (numbers in millions of US dollars).
Date | Revenue | Operating Cash Flow | Net Income to Common Stock |
---|---|---|---|
2022-12-31 | 4,318 | 201 | 352 |
2022-09-30 | 4,321 | 100 | 209 |
2022-06-30 | 4,113 | 95 | 144 |
2022-03-31 | 3,881 | 132 | 133 |
2021-12-31 | 3,631 | 187 | 101 |
2021-09-30 | 3,409 | 257 | 250 |
CBT's Quality Factors
The “Quality” component of the POWR Ratings focuses on 31 different factors of a companies fundamentals and operational strength. Here are some key insights as we drill into the specifics of these quality attributes.- CBT has a Quality Grade of B, ranking ahead of 87.56% of graded US stocks.
- CBT's asset turnover comes in at 1.052 -- ranking 13th of 89 Chemicals stocks.
- IOSP, TOMZ, and MTX are the stocks whose asset turnover ratios are most correlated with CBT.
The table below shows CBT's key quality metrics over time.
Period | Asset Turnover | Gross Margin | ROIC |
---|---|---|---|
2021-06-30 | 1.052 | 0.240 | 0.087 |
2021-03-31 | 0.935 | 0.222 | 0.047 |
2020-12-31 | 0.887 | 0.210 | 0.015 |
2020-09-30 | 0.868 | 0.191 | 0.002 |
2020-06-30 | 0.907 | 0.192 | 0.049 |
2020-03-31 | 1.005 | 0.204 | 0.071 |
CBT Price Target
For more insight on analysts targets of CBT, see our CBT price target page. And for a list of of all stocks sorted by upside potential based on analyst target price, see our Top Price Target page.
Average Price Target | $71.67 | Average Broker Recommendation | 1.43 (Moderate Buy) |
Cabot Corporation (CBT) Company Bio
Cabot Corporation is a leading provider of rubber and specialty carbons, activated carbon, inkjet colorants, cesium formate drilling fluids, fumed silica, and aerogel. The company was founded in 1882 and is based in Boston, Massachusetts.
Latest CBT News From Around the Web
Below are the latest news stories about CABOT CORP that investors may wish to consider to help them evaluate CBT as an investment opportunity.
Cabot Corporation's (NYSE:CBT) Stock Is Going Strong: Is the Market Following Fundamentals?Cabot (NYSE:CBT) has had a great run on the share market with its stock up by a significant 14% over the last month... |
Cabot Corp's Dividend AnalysisCabot Corp (NYSE:CBT) recently announced a dividend of $0.4 per share, payable on 2023-12-08, with the ex-dividend date set for 2023-11-22. Using the data from GuruFocus, let's look into Cabot Corp's dividend performance and assess its sustainability. What Does Cabot Corp Do? |
Cabot Corporation (NYSE:CBT) Passed Our Checks, And It's About To Pay A US$0.40 DividendRegular readers will know that we love our dividends at Simply Wall St, which is why it's exciting to see Cabot... |
Here's Why Cabot (CBT) is a Strong Value StockWhether you're a value, growth, or momentum investor, finding strong stocks becomes easier with the Zacks Style Scores, a top feature of the Zacks Premium research service. |
Cabot Corporation Board Declares DividendBOSTON, November 10, 2023--On Friday, November 10, 2023, the Board of Directors of Cabot Corporation (NYSE:CBT) declared a quarterly dividend of $0.40 per share on all outstanding shares of the Corporation’s common stock. The dividend is payable on December 8, 2023, to stockholders of record at the close of business on November 24, 2023. |
CBT Price Returns
1-mo | 16.94% |
3-mo | 10.33% |
6-mo | 6.21% |
1-year | 10.27% |
3-year | 91.65% |
5-year | 93.28% |
YTD | 17.86% |
2022 | 21.38% |
2021 | 28.40% |
2020 | -2.16% |
2019 | 14.25% |
2018 | -28.70% |
CBT Dividends
Ex-Dividend Date | Type | Payout Amount | Change | ||||||
---|---|---|---|---|---|---|---|---|---|
Loading, please wait... |
Continue Researching CBT
Here are a few links from around the web to help you further your research on Cabot Corp's stock as an investment opportunity:Cabot Corp (CBT) Stock Price | Nasdaq
Cabot Corp (CBT) Stock Quote, History and News - Yahoo Finance
Cabot Corp (CBT) Stock Price and Basic Information | MarketWatch
Loading social stream, please wait...