Community Bank System, Inc. (CBU): Price and Financial Metrics
GET POWR RATINGS... FREE!
CBU POWR Grades
- Stability is the dimension where CBU ranks best; there it ranks ahead of 93.52% of US stocks.
- The strongest trend for CBU is in Momentum, which has been heading up over the past 179 days.
- CBU ranks lowest in Value; there it ranks in the 3rd percentile.
CBU Stock Summary
- CBU's went public 36.27 years ago, making it older than 92.84% of listed US stocks we're tracking.
- Equity multiplier, or assets relative to shareholders' equity, comes in at 7.35 for Community Bank System Inc; that's greater than it is for 85.73% of US stocks.
- The volatility of Community Bank System Inc's share price is greater than that of only 2.2% US stocks with at least 200 days of trading history.
- Stocks with similar financial metrics, market capitalization, and price volatility to Community Bank System Inc are ABCB, NBTB, UCBI, NWBI, and UBSI.
- CBU's SEC filings can be seen here. And to visit Community Bank System Inc's official web site, go to cbna.com.
CBU Valuation Summary
- CBU's price/earnings ratio is 21; this is 90.91% higher than that of the median Financial Services stock.
- CBU's price/sales ratio has moved up 3 over the prior 243 months.
Below are key valuation metrics over time for CBU.
Stock | Date | P/S | P/B | P/E | EV/EBIT |
---|---|---|---|---|---|
CBU | 2021-05-14 | 7.3 | 2.2 | 24.6 | 11.2 |
CBU | 2018-08-08 | 6.1 | 2.0 | 19.8 | 17.7 |
CBU | 2014-02-10 | 4.1 | 1.6 | 17.0 | 16.3 |
CBU | 2013-01-15 | 3.6 | 1.2 | 14.4 | 15.0 |
CBU | 2011-12-30 | 3.6 | 1.4 | 14.6 | 14.7 |
CBU | 2006-01-10 | 3.5 | 1.5 | 12.6 | 16.7 |
CBU Growth Metrics
- Its 2 year price growth rate is now at -5.38%.
- Its 4 year net cashflow from operations growth rate is now at 62.51%.
- Its 3 year revenue growth rate is now at 47.04%.

The table below shows CBU's growth in key financial areas (numbers in millions of US dollars).
Date | Revenue | Operating Cash Flow | Net Income to Common Stock |
---|---|---|---|
2021-12-31 | 629.486 | 202.546 | 189.694 |
2021-09-30 | 625.705 | 207.27 | 192.615 |
2021-06-30 | 618.52 | 172.205 | 190.088 |
2021-03-31 | 597.732 | 214.599 | 177.392 |
2020-12-31 | 582.61 | 179.483 | 164.676 |
2020-09-30 | 575.882 | 198.753 | 161.075 |
CBU's Quality Factors
The “Quality” component of the POWR Ratings focuses on 31 different factors of a companies fundamentals and operational strength. Here are some key insights as we drill into the specifics of these quality attributes.- CBU has a Quality Grade of C, ranking ahead of 36.34% of graded US stocks.
- CBU's asset turnover comes in at 0.043 -- ranking 130th of 430 Banking stocks.
- FIBK, OVLY, and PLBC are the stocks whose asset turnover ratios are most correlated with CBU.
The table below shows CBU's key quality metrics over time.
Period | Asset Turnover | Gross Margin | ROIC |
---|---|---|---|
2021-06-30 | 0.043 | 1 | 0.020 |
2021-03-31 | 0.043 | 1 | 0.019 |
2020-12-31 | 0.044 | 1 | 0.018 |
2020-09-30 | 0.046 | 1 | 0.018 |
2020-06-30 | 0.047 | 1 | 0.018 |
2020-03-31 | 0.051 | 1 | 0.020 |
CBU Price Target
For more insight on analysts targets of CBU, see our CBU price target page. And for a list of of all stocks sorted by upside potential based on analyst target price, see our Top Price Target page.
Average Price Target | $75.75 | Average Broker Recommendation | 2 (Hold) |
CBU Stock Price Chart Interactive Chart >
CBU Price/Volume Stats
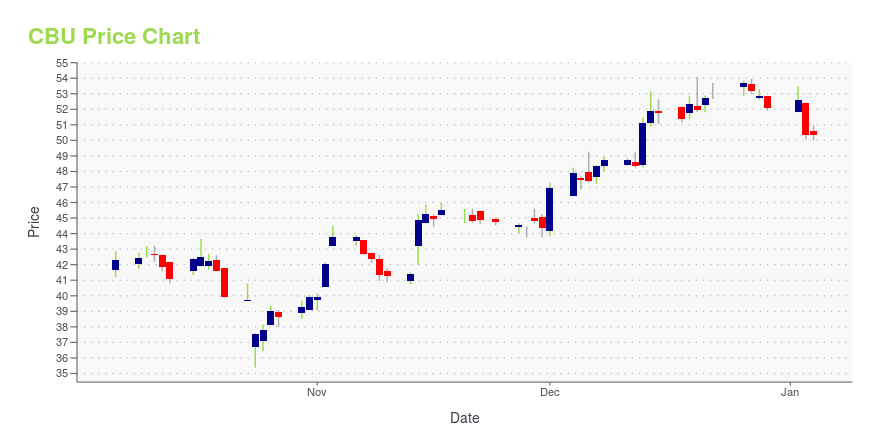
Current price | $63.28 | 52-week high | $78.00 |
Prev. close | $63.22 | 52-week low | $61.08 |
Day low | $62.06 | Volume | 206,800 |
Day high | $63.87 | Avg. volume | 225,882 |
50-day MA | $64.75 | Dividend yield | 2.72% |
200-day MA | $70.21 | Market Cap | 3.41B |
Community Bank System, Inc. (CBU) Company Bio
Community Bank System, Inc. provides various banking and financial services to retail, commercial, and municipal customers in Upstate New York and Northeastern Pennsylvania. The company was founded in 1983 and is based in Dewitt, New York.
Latest CBU News From Around the Web
Below are the latest news stories about Community Bank System Inc that investors may wish to consider to help them evaluate CBU as an investment opportunity.
Community Bank System declares $0.43 dividendCommunity Bank System, Inc. (NYSE:CBU) $0.43/share quarterly dividend, in line with previous.Forward yield 2.34%Payable April 11; for shareholders of record March 15; ex-div March… |
Community Bank System, Inc. Announces Quarterly DividendSYRACUSE, N.Y.--(BUSINESS WIRE)--Community Bank System, Inc. Announces Quarterly Dividend |
Community Bank System's (NYSE:CBU) investors will be pleased with their decent 39% return over the last five yearsIf you buy and hold a stock for many years, you'd hope to be making a profit. Better yet, you'd like to see the share... |
Colorado Capital Management, Inc. Buys Community Bank System Inc, WisdomTree Europe Quality ...Investment company Colorado Capital Management, Inc. (Current Portfolio) buys Community Bank System Inc, WisdomTree Europe Quality Dividend Growth Fund, Abbott Laboratories, Novo Nordisk A/S, AbbVie Inc, sells JPMorgan Ultra-Short Income ETF, iShares 1-3 Year Treasury Bond ETF, iShares Russell Mid-Cap ETF during the 3-months ended 2021Q4, according to the most recent filings of the investment company, Colorado Capital Management, Inc.. |
Elmira Savings Bank Reports 2021 EarningsELMIRA, N.Y., Jan. 26, 2022 (GLOBE NEWSWIRE) -- Elmira Savings Bank (NASDAQ:ESBK) Highlights Net income was $1,102,000 and $5,219,000 for the three and twelve months ended December 31, 2021 compared to $1,284,000 and $4,159,000 for the same periods in 2020.Diluted earnings per share were $.31 per share and $1.48 per share for the three and twelve months ended December 31, 2021 compared to $.37 per share and $1.19 per share for the same periods in 2020. Return on average assets was .69% and .81% |
CBU Price Returns
1-mo | -3.31% |
3-mo | -10.24% |
6-mo | -13.93% |
1-year | -14.75% |
3-year | 5.64% |
5-year | 28.64% |
YTD | -13.93% |
2021 | 22.28% |
2020 | -9.59% |
2019 | 24.69% |
2018 | 11.06% |
2017 | -10.90% |
CBU Dividends
Ex-Dividend Date | Type | Payout Amount | Change | ||||||
---|---|---|---|---|---|---|---|---|---|
Loading, please wait... |
Continue Researching CBU
Want to see what other sources are saying about Community Bank System Inc's financials and stock price? Try the links below:Community Bank System Inc (CBU) Stock Price | Nasdaq
Community Bank System Inc (CBU) Stock Quote, History and News - Yahoo Finance
Community Bank System Inc (CBU) Stock Price and Basic Information | MarketWatch
Loading social stream, please wait...