
Crescent Capital BDC, Inc. (CCAP): Price and Financial Metrics
CCAP Price/Volume Stats
| Current price | $14.72 | 52-week high | $20.19 |
| Prev. close | $14.74 | 52-week low | $13.54 |
| Day low | $14.65 | Volume | 220,559 |
| Day high | $14.80 | Avg. volume | 179,693 |
| 50-day MA | $15.06 | Dividend yield | 11.61% |
| 200-day MA | $17.50 | Market Cap | 545.52M |
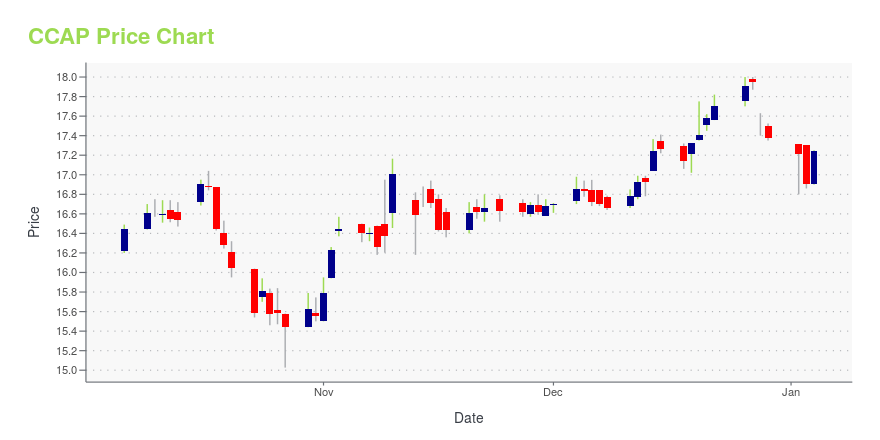
CCAP Stock Price Chart Interactive Chart >
Crescent Capital BDC, Inc. (CCAP) Company Bio
Crescent Capital BDC, Inc. was incorporated in 2015 and is based in Los Angeles, California.
CCAP Price Returns
| 1-mo | 2.43% |
| 3-mo | 0.06% |
| 6-mo | -18.70% |
| 1-year | -15.06% |
| 3-year | 30.60% |
| 5-year | 108.43% |
| YTD | -18.70% |
| 2024 | 23.51% |
| 2023 | 52.61% |
| 2022 | -18.48% |
| 2021 | 32.48% |
| 2020 | -8.00% |
CCAP Dividends
| Ex-Dividend Date | Type | Payout Amount | Change | ||||||
|---|---|---|---|---|---|---|---|---|---|
| Loading, please wait... | |||||||||
Loading social stream, please wait...