CNB Financial Corporation (CCNE): Price and Financial Metrics
CCNE Price/Volume Stats
Current price | $17.90 | 52-week high | $28.50 |
Prev. close | $17.07 | 52-week low | $16.43 |
Day low | $17.29 | Volume | 106,700 |
Day high | $17.97 | Avg. volume | 70,785 |
50-day MA | $18.06 | Dividend yield | 4.1% |
200-day MA | $22.86 | Market Cap | 377.03M |
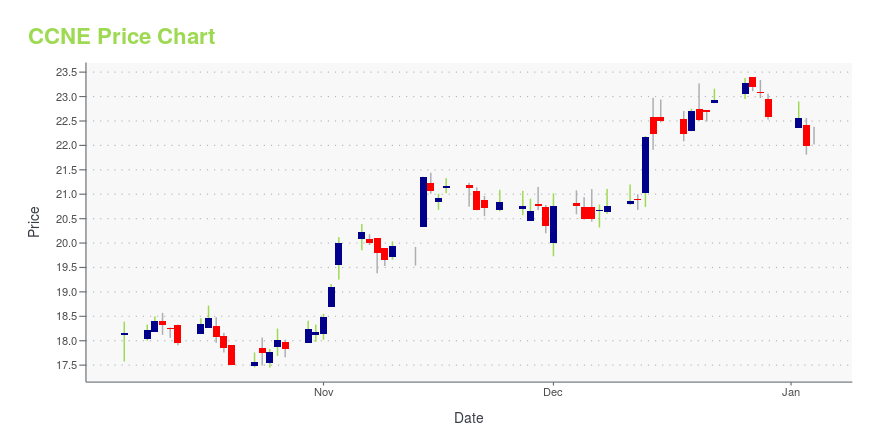
CCNE Stock Price Chart Interactive Chart >
CCNE POWR Grades
- CCNE scores best on the Stability dimension, with a Stability rank ahead of 79.21% of US stocks.
- CCNE's strongest trending metric is Stability; it's been moving down over the last 179 days.
- CCNE's current lowest rank is in the Quality metric (where it is better than 15.13% of US stocks).
CCNE Stock Summary
- Equity multiplier, or assets relative to shareholders' equity, comes in at 10.75 for CNB FINANCIAL CORP; that's greater than it is for 91.38% of US stocks.
- With a year-over-year growth in debt of 84.95%, CNB FINANCIAL CORP's debt growth rate surpasses 87.26% of about US stocks.
- CNB FINANCIAL CORP's shareholder yield -- a measure of how much capital is returned to stockholders via dividends and buybacks -- is -49.38%, greater than the shareholder yield of only 10.55% of stocks in our set.
- Stocks with similar financial metrics, market capitalization, and price volatility to CNB FINANCIAL CORP are RVSB, LCNB, CFFI, WABC, and PEBO.
- Visit CCNE's SEC page to see the company's official filings. To visit the company's web site, go to www.cnbbank.bank.
CCNE Valuation Summary
- CCNE's price/sales ratio is 1.7; this is 22.73% lower than that of the median Financial Services stock.
- Over the past 243 months, CCNE's price/sales ratio has gone down 3.7.
Below are key valuation metrics over time for CCNE.
Stock | Date | P/S | P/B | P/E | EV/EBIT |
---|---|---|---|---|---|
CCNE | 2023-05-19 | 1.7 | 0.7 | 6.1 | 5.3 |
CCNE | 2023-05-18 | 1.7 | 0.7 | 6.3 | 5.4 |
CCNE | 2023-05-17 | 1.7 | 0.7 | 6.2 | 5.4 |
CCNE | 2023-05-16 | 1.6 | 0.7 | 5.9 | 5.2 |
CCNE | 2023-05-15 | 1.6 | 0.7 | 6.0 | 5.2 |
CCNE | 2023-05-12 | 1.6 | 0.6 | 5.9 | 5.1 |
CCNE Growth Metrics
- Its year over year price growth rate is now at 0.51%.
- Its 5 year price growth rate is now at -35.35%.
- The year over year net cashflow from operations growth rate now stands at 102.73%.

The table below shows CCNE's growth in key financial areas (numbers in millions of US dollars).
Date | Revenue | Operating Cash Flow | Net Income to Common Stock |
---|---|---|---|
2022-09-30 | 209.115 | 58.549 | 57.635 |
2022-06-30 | 199.948 | 59.79 | 55.917 |
2022-03-31 | 192.601 | 51.598 | 54.469 |
2021-12-31 | 187.211 | 58.92 | 53.405 |
2021-09-30 | 181.836 | 48.002 | 46.604 |
2021-06-30 | 172.363 | 35.148 | 40.558 |
CCNE's Quality Factors
The “Quality” component of the POWR Ratings focuses on 31 different factors of a companies fundamentals and operational strength. Here are some key insights as we drill into the specifics of these quality attributes.- CCNE has a Quality Grade of C, ranking ahead of 34.43% of graded US stocks.
- CCNE's asset turnover comes in at 0.036 -- ranking 265th of 428 Banking stocks.
- FMBI, SRCE, and CTBI are the stocks whose asset turnover ratios are most correlated with CCNE.
The table below shows CCNE's key quality metrics over time.
Period | Asset Turnover | Gross Margin | ROIC |
---|---|---|---|
2021-09-30 | 0.036 | 1 | 0.014 |
2021-06-30 | 0.035 | 1 | 0.012 |
2021-03-31 | 0.034 | 1 | 0.011 |
2020-12-31 | 0.033 | 1 | 0.010 |
2020-09-30 | 0.033 | 1 | 0.010 |
2020-06-30 | 0.035 | 1 | 0.012 |
CCNE Price Target
For more insight on analysts targets of CCNE, see our CCNE price target page. And for a list of of all stocks sorted by upside potential based on analyst target price, see our Top Price Target page.
Average Price Target | $28.67 | Average Broker Recommendation | 1.5 (Moderate Buy) |
CNB Financial Corporation (CCNE) Company Bio
CNB Financial Corporation operates as the bank holding company for CNB Bank that provides various banking products and services for individual, business, governmental, and institutional customers in Pennsylvania and Ohio. The company was founded in 1934 and is based in Clearfield, Pennsylvania.
Latest CCNE News From Around the Web
Below are the latest news stories about CNB FINANCIAL CORP that investors may wish to consider to help them evaluate CCNE as an investment opportunity.
CNB Financial (NASDAQ:CCNE) Is Paying Out A Dividend Of $0.175CNB Financial Corporation ( NASDAQ:CCNE ) has announced that it will pay a dividend of $0.175 per share on the 15th of... |
CNB Financial Corporation Announces Quarterly Dividend for Common StockCLEARFIELD, Pa., May 09, 2023 (GLOBE NEWSWIRE) -- The Board of Directors of CNB Financial Corporation (Nasdaq: CCNE) declared a quarterly cash dividend of $0.175 per share of common stock payable on June 15, 2023 to common stock shareholders of record as of June 1, 2023. CNB Financial Corporation is a financial holding company with consolidated assets of approximately $5.6 billion. CNB Financial Corporation conducts business primarily through its principal subsidiary, CNB Bank. CNB Bank is a ful |
CNB Financial Corporation Announces Quarterly Dividend For Series A Preferred Stock and Related Depositary Shares DistributionCLEARFIELD, Pa., May 04, 2023 (GLOBE NEWSWIRE) -- The Board of Directors of CNB Financial Corporation (Nasdaq: CCNE) (the "Corporation") has announced the declaration of a quarterly cash dividend of $0.4453125 per depositary share, resulting from the Corporation’s declaration of a quarterly cash dividend of $17.8125 per share on its Series A Preferred Stock. The dividend is payable on June 1, 2023, to holders of record as of May 18, 2023. CNB Financial Corporation is a financial holding company |
CNB Financial (CCNE) Meets Q1 Earnings EstimatesCNB (CCNE) delivered earnings and revenue surprises of 0% and 5.30%, respectively, for the quarter ended March 2023. Do the numbers hold clues to what lies ahead for the stock? |
CNB Financial Corporation Reports First Quarter 2023 ResultsCLEARFIELD, Pa., April 17, 2023 (GLOBE NEWSWIRE) -- CNB Financial Corporation (“CNB” or the “Corporation”) (NASDAQ: CCNE), the parent company of CNB Bank, today announced its earnings for the three months ended March 31, 2023, and disclosed quarterly growth in total deposits, loans, and assets. Executive Summary Net income available to common shareholders ("earnings") was $15.4 million, or $0.73 per diluted share, for the three months ended March 31, 2023, reflecting a sequential quarterly incre |
CCNE Price Returns
1-mo | 0.63% |
3-mo | -23.80% |
6-mo | -26.10% |
1-year | -26.11% |
3-year | 4.85% |
5-year | -33.30% |
YTD | -23.43% |
2022 | -7.75% |
2021 | 27.96% |
2020 | -32.58% |
2019 | 45.93% |
2018 | -10.49% |
CCNE Dividends
Ex-Dividend Date | Type | Payout Amount | Change | ||||||
---|---|---|---|---|---|---|---|---|---|
Loading, please wait... |
Continue Researching CCNE
Here are a few links from around the web to help you further your research on Cnb Financial Corp's stock as an investment opportunity:Cnb Financial Corp (CCNE) Stock Price | Nasdaq
Cnb Financial Corp (CCNE) Stock Quote, History and News - Yahoo Finance
Cnb Financial Corp (CCNE) Stock Price and Basic Information | MarketWatch
Loading social stream, please wait...