
Century Communities, Inc. (CCS): Price and Financial Metrics
CCS Price/Volume Stats
| Current price | $101.51 | 52-week high | $105.17 |
| Prev. close | $99.80 | 52-week low | $58.01 |
| Day low | $100.44 | Volume | 428,727 |
| Day high | $105.17 | Avg. volume | 313,560 |
| 50-day MA | $85.53 | Dividend yield | 1.05% |
| 200-day MA | $82.10 | Market Cap | 3.23B |
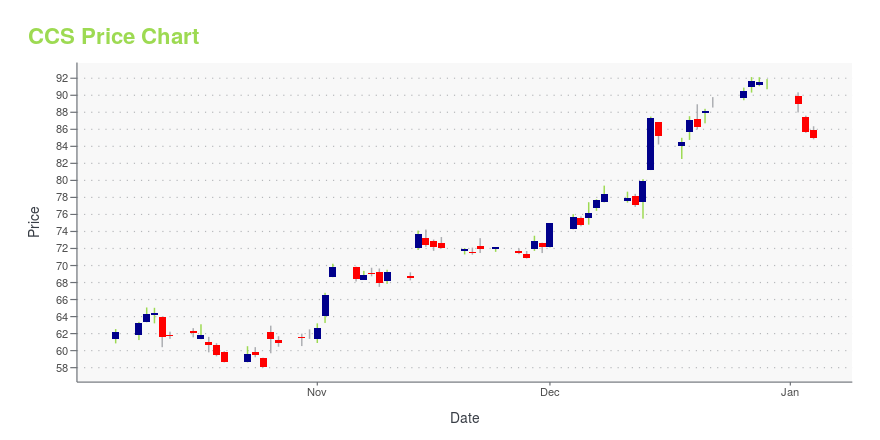
CCS Stock Price Chart Interactive Chart >
Century Communities, Inc. (CCS) Company Bio
Century Communities, Inc. engages in homebuilding business in Atlanta, Central Texas, Colorado, Houston, and Nevada. The company was founded in 2000 and is based in Greenwood Village, Colorado.
Latest CCS News From Around the Web
Below are the latest news stories about CENTURY COMMUNITIES INC that investors may wish to consider to help them evaluate CCS as an investment opportunity.
Are Investors Undervaluing Century Communities (CCS) Right Now?Here at Zacks, our focus is on the proven Zacks Rank system, which emphasizes earnings estimates and estimate revisions to find great stocks. Nevertheless, we are always paying attention to the latest value, growth, and momentum trends to underscore strong picks. |
Century Communities Sets Date for Fourth Quarter and Full Year 2023 Earnings Release and Conference CallCentury Communities, Inc. (NYSE: CCS), a leading national homebuilder, today announced that the Company will release its fourth quarter and full year 2023 financial results after the market closes on Wednesday, January 31, 2024. A conference call will be held that same day at 5:00 p.m. Eastern time, 3:00 p.m. Mountain time, to review the Company's fourth quarter and full year results, discuss recent events and conduct a question-and-answer session. |
Century Complete Announces New Community in Union, SCCentury Communities, Inc., a top 10 national homebuilder, an industry leader in online home sales, and the highest-ranked homebuilder on Newsweek's list of America's Most Trustworthy Companies 2023—announced that its Century Complete brand has opened a new community—Buffalo Creek—in Union, SC, located near other Century Complete communities in Spartanburg, Boiling Springs and Gaffney. |
Century Communities Announces Grand Opening in Hanford, CaliforniaCentury Communities, Inc. (NYSE: CCS)—a top 10 national homebuilder, industry leader in online home sales, and the highest-ranked homebuilder on Newsweek's list of America's Most Trustworthy Companies 2023—has introduced two brand-new model homes at its exciting new Hanford community, Live Oak. |
Is Century Communities, Inc.'s (NYSE:CCS) Recent Stock Performance Tethered To Its Strong Fundamentals?Century Communities (NYSE:CCS) has had a great run on the share market with its stock up by a significant 13% over the... |
CCS Price Returns
| 1-mo | 28.44% |
| 3-mo | 29.19% |
| 6-mo | 18.13% |
| 1-year | 33.19% |
| 3-year | 70.86% |
| 5-year | 284.27% |
| YTD | 12.07% |
| 2023 | 84.79% |
| 2022 | -37.92% |
| 2021 | 87.95% |
| 2020 | 60.07% |
| 2019 | 58.46% |
CCS Dividends
| Ex-Dividend Date | Type | Payout Amount | Change | ||||||
|---|---|---|---|---|---|---|---|---|---|
| Loading, please wait... | |||||||||
Continue Researching CCS
Want to see what other sources are saying about Century Communities Inc's financials and stock price? Try the links below:Century Communities Inc (CCS) Stock Price | Nasdaq
Century Communities Inc (CCS) Stock Quote, History and News - Yahoo Finance
Century Communities Inc (CCS) Stock Price and Basic Information | MarketWatch
Loading social stream, please wait...