
Chindata Group Holdings Ltd. ADR (CD): Price and Financial Metrics
CD Price/Volume Stats
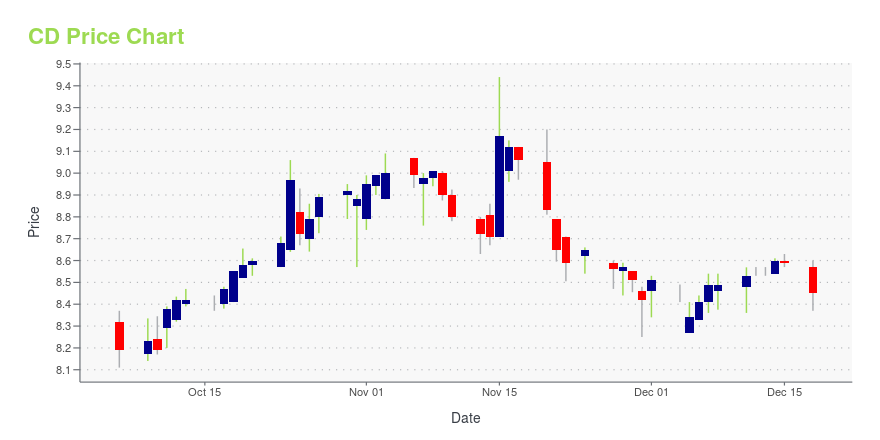
| Current price | $8.45 | 52-week high | $9.44 |
| Prev. close | $8.59 | 52-week low | $4.86 |
| Day low | $8.37 | Volume | 11,794,800 |
| Day high | $8.60 | Avg. volume | 1,909,726 |
| 50-day MA | $8.66 | Dividend yield | N/A |
| 200-day MA | $7.58 | Market Cap | 3.44B |
CD Stock Price Chart Interactive Chart >
Chindata Group Holdings Ltd. ADR (CD) Company Bio
Chindata Group Holdings Ltd. operates data centers. It provides carrier-neutral hyperscale data center solutions in Asia-Pacific emerging markets, focusing on the China, India and Southeast Asia markets. The company was founded by Jing Ju in 2015 and is headquartered in Beijing, China.
Latest CD News From Around the Web
Below are the latest news stories about CHINDATA GROUP HOLDINGS LTD that investors may wish to consider to help them evaluate CD as an investment opportunity.
Chindata Scoops Two Data Center Category Prizes at Prestigious 2023 Global Carrier Awards in LondonChindata Group Holdings Limited ("Chindata Group" or "the Company") (Nasdaq: CD), a leading carrier-neutral hyperscale data center solution provider in Asia-Pacific emerging markets, came home with the Best Data Center Service Provider Award and the Best Data Center/Edge Service Innovation Award at the prestigious 2023 Global Carrier Awards (GCAs) held on October 18, 2023, in London. |
Chindata Group to Hold Extraordinary General Meeting of ShareholdersBEIJING, Oct. 19, 2023 (GLOBE NEWSWIRE) -- Chindata Group Holdings Limited (“Chindata Group” or the “Company”) (Nasdaq: CD), a leading carrier-neutral hyperscale data center solution provider in Asia-Pacific emerging markets, today announced that it has called an extraordinary general meeting of shareholders (the “EGM”), to be held on December 4, 2023 at 10:30 a.m. (Beijing time), at No. 47 Laiguangying East Road, Chaoyang District, Beijing, People’s Republic of China, to consider and vote on, a |
10 Reddit Stocks with Biggest UpsideIn this article, we will take a look at the 10 Reddit stocks with biggest upside . To see more such companies, go directly to 5 Reddit Stocks with Biggest Upside. Rising inflation and persistent rate hikes have finally started to show their real effects. As inflation eats into the savings of millions of Americans, […] |
Chindata Group Holdings Limited (NASDAQ:CD) Q2 2023 Earnings Call TranscriptChindata Group Holdings Limited (NASDAQ:CD) Q2 2023 Earnings Call Transcript August 31, 2023 Chindata Group Holdings Limited beats earnings expectations. Reported EPS is $0.71, expectations were $0.39. Operator: Good morning and good evening, ladies and gentlemen. Thank you for joining, and welcome to Chindata Group Holdings Limited Second Quarter 2023 Earnings Conference Call. We will […] |
Chindata Reveals Impressive Revenue Leap of 49.7% in Its Unaudited Q2 2023 Financial ReportChindata Group Holdings Limited ("Chindata Group" or the "Company") (Nasdaq: CD), a leading carrier-neutral hyperscale data center solution provider in Asia-Pacific emerging markets, announced its unaudited financial report for the second quarter of 2023 on August 31, 2023. |
CD Price Returns
| 1-mo | N/A |
| 3-mo | N/A |
| 6-mo | N/A |
| 1-year | 7.37% |
| 3-year | -25.94% |
| 5-year | N/A |
| YTD | N/A |
| 2023 | 0.00% |
| 2022 | 20.94% |
| 2021 | -72.50% |
| 2020 | N/A |
| 2019 | N/A |
Loading social stream, please wait...