
Ceridian HCM Holding Inc. (CDAY): Price and Financial Metrics
CDAY Price/Volume Stats
| Current price | $69.52 | 52-week high | $79.66 |
| Prev. close | $69.45 | 52-week low | $55.62 |
| Day low | $69.10 | Volume | 2,683,800 |
| Day high | $70.67 | Avg. volume | 1,312,424 |
| 50-day MA | $67.39 | Dividend yield | N/A |
| 200-day MA | $67.47 | Market Cap | 10.85B |
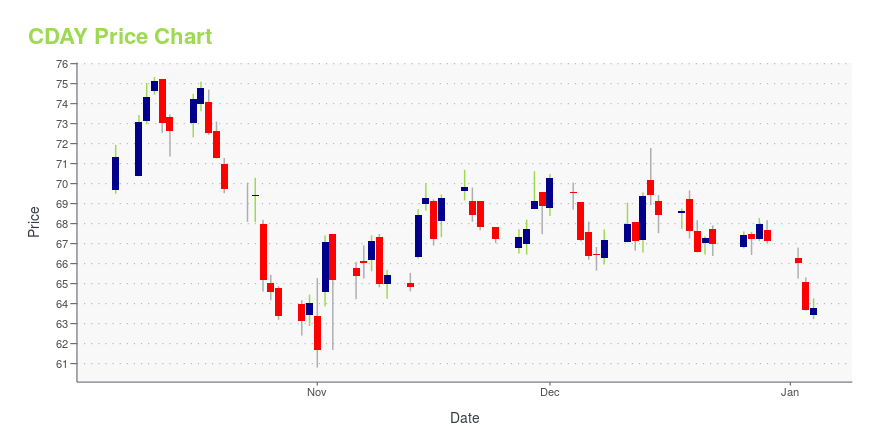
CDAY Stock Price Chart Interactive Chart >
Ceridian HCM Holding Inc. (CDAY) Company Bio
Ceridian HCM is an American provider of human resources software and services with employees in the USA, Canada, Europe, Australia and Mauritius. It is a publicly traded company on the New York Stock Exchange. (Source:Wikipedia)
Latest CDAY News From Around the Web
Below are the latest news stories about CERIDIAN HCM HOLDING INC that investors may wish to consider to help them evaluate CDAY as an investment opportunity.
Why Zscaler (ZS) is a Strong Contender for Portfolio PickZscaler (ZS) appears to be an enticing investment option at the moment, with its strong demand environment, healthy fundamentals and upward estimate revisions. |
25 Cheapest Online Business Degree Programs Heading Into 2024In this article, we will be looking at the 25 cheapest online business degree programs heading into 2024. If you want to skip our detailed analysis, you can go directly to the 5 Cheapest Online Business Degree Programs Heading Into 2024. Human Resources: Career Spotlight Joining the human resources industry is a popular career choice […] |
Nice (NICE) Strengthens Portfolio With LiveVox AcquisitionNice (NICE) elevates customer experience with LiveVox acquisition, forging a dynamic synergy for AI-driven interactions. |
Micron (MU) & Fujian Jinhua Reach IP Theft Lawsuit SettlementMicron Technology (MU) navigates geopolitical tensions, settles IP theft suit with Fujian Jinhua amid China's chip restrictions, reshaping semiconductor dynamics. |
Alphabet (GOOGL) Strengthens Messaging App With Latest MoveAlphabet's (GOOGL) Google expands its global reach by introducing the Magic Compose feature in France and the United Kingdom. |
CDAY Price Returns
| 1-mo | N/A |
| 3-mo | N/A |
| 6-mo | 1.94% |
| 1-year | -0.70% |
| 3-year | -29.36% |
| 5-year | 31.22% |
| YTD | 3.58% |
| 2023 | 4.63% |
| 2022 | -38.59% |
| 2021 | -1.97% |
| 2020 | 56.98% |
| 2019 | 96.81% |
Continue Researching CDAY
Want to see what other sources are saying about Ceridian HCM Holding Inc's financials and stock price? Try the links below:Ceridian HCM Holding Inc (CDAY) Stock Price | Nasdaq
Ceridian HCM Holding Inc (CDAY) Stock Quote, History and News - Yahoo Finance
Ceridian HCM Holding Inc (CDAY) Stock Price and Basic Information | MarketWatch
Loading social stream, please wait...