Avid Bioservices, Inc. (CDMO): Price and Financial Metrics
CDMO Price/Volume Stats
Current price | $9.70 | 52-week high | $21.05 |
Prev. close | $9.60 | 52-week low | $9.18 |
Day low | $9.44 | Volume | 230,848 |
Day high | $9.87 | Avg. volume | 571,406 |
50-day MA | $11.92 | Dividend yield | N/A |
200-day MA | $15.13 | Market Cap | 612.20M |
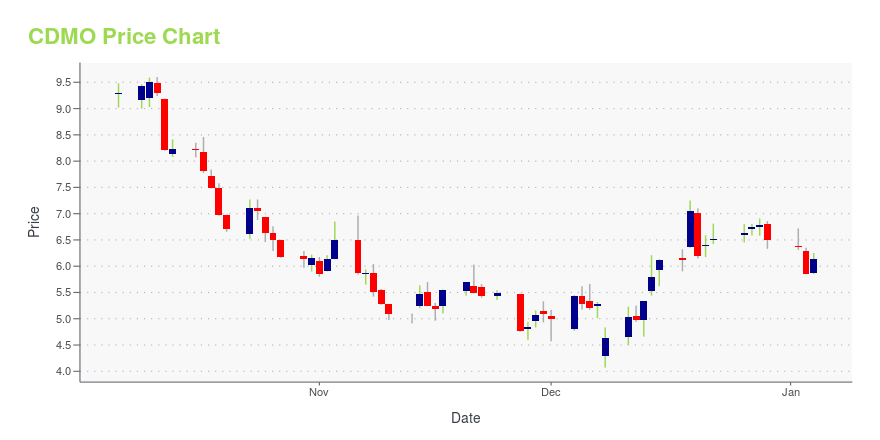
CDMO Stock Price Chart Interactive Chart >
CDMO POWR Grades
- CDMO scores best on the Stability dimension, with a Stability rank ahead of 28.2% of US stocks.
- CDMO's strongest trending metric is Stability; it's been moving up over the last 179 days.
- CDMO's current lowest rank is in the Quality metric (where it is better than 0.83% of US stocks).
CDMO Stock Summary
- CDMO's one year PEG ratio, measuring expected growth in earnings next year relative to current common stock price is 201.8 -- higher than 86.29% of US-listed equities with positive expected earnings growth.
- Of note is the ratio of AVID BIOSERVICES INC's sales and general administrative expense to its total operating expenses; 87.22% of US stocks have a lower such ratio.
- The ratio of debt to operating expenses for AVID BIOSERVICES INC is higher than it is for about 86.84% of US stocks.
- Stocks that are quantitatively similar to CDMO, based on their financial statements, market capitalization, and price volatility, are CHCI, TIRX, DHIL, CLEU, and SGBX.
- CDMO's SEC filings can be seen here. And to visit AVID BIOSERVICES INC's official web site, go to avidbio.com.
CDMO Valuation Summary
- CDMO's price/sales ratio is 4.2; this is 121.05% higher than that of the median Healthcare stock.
- Over the past 243 months, CDMO's price/sales ratio has gone down 70.7.
Below are key valuation metrics over time for CDMO.
Stock | Date | P/S | P/B | P/E | EV/EBIT |
---|---|---|---|---|---|
CDMO | 2023-09-18 | 4.2 | 3.3 | -203.4 | -9121.8 |
CDMO | 2023-09-15 | 4.4 | 3.4 | -212.1 | -9433.3 |
CDMO | 2023-09-14 | 4.4 | 3.5 | -215.8 | -9564.4 |
CDMO | 2023-09-13 | 4.3 | 3.4 | -210.0 | -9357.5 |
CDMO | 2023-09-12 | 4.3 | 3.4 | -210.7 | -9382.8 |
CDMO | 2023-09-11 | 4.5 | 3.6 | -219.9 | -9709.2 |
CDMO Growth Metrics
- Its 3 year net cashflow from operations growth rate is now at 181.63%.
- Its 3 year revenue growth rate is now at 123.12%.
- The 3 year price growth rate now stands at 279.25%.

The table below shows CDMO's growth in key financial areas (numbers in millions of US dollars).
Date | Revenue | Operating Cash Flow | Net Income to Common Stock |
---|---|---|---|
2022-09-30 | 134.183 | -2.967 | 118.254 |
2022-06-30 | 125.535 | 11.373 | 122.932 |
2022-03-31 | 119.597 | 9.465 | 127.672 |
2021-12-31 | 115.977 | 26.713 | 9.775 |
2021-09-30 | 106.275 | 26.71 | 8.292 |
2021-06-30 | 101.23 | 26.513 | 5.612 |
CDMO's Quality Factors
The “Quality” component of the POWR Ratings focuses on 31 different factors of a companies fundamentals and operational strength. Here are some key insights as we drill into the specifics of these quality attributes.- CDMO has a Quality Grade of C, ranking ahead of 27.37% of graded US stocks.
- CDMO's asset turnover comes in at 0.495 -- ranking 83rd of 682 Pharmaceutical Products stocks.
- COCP, HROW, and IBIO are the stocks whose asset turnover ratios are most correlated with CDMO.
The table below shows CDMO's key quality metrics over time.
Period | Asset Turnover | Gross Margin | ROIC |
---|---|---|---|
2021-07-31 | 0.495 | 0.318 | 0.126 |
2021-04-30 | 0.587 | 0.306 | 0.157 |
2021-01-31 | 0.653 | 0.246 | 0.079 |
2020-10-31 | 0.672 | 0.199 | 0.002 |
2020-07-31 | 0.659 | 0.163 | -0.044 |
2020-04-30 | 0.568 | 0.066 | -0.173 |
CDMO Price Target
For more insight on analysts targets of CDMO, see our CDMO price target page. And for a list of of all stocks sorted by upside potential based on analyst target price, see our Top Price Target page.
Average Price Target | $28.25 | Average Broker Recommendation | 1.38 (Strong Buy) |
Avid Bioservices, Inc. (CDMO) Company Bio
Avid Bioservices, Inc., formerly Peregrine Pharmaceuticals, researches and develops monoclonal antibodies for the treatment of cancer in the United States. Its lead immunotherapy candidate includes bavituximab, a monoclonal antibody that targets and binds to phosphatidylserine. The company was founded in 1981 and is based in Tustin, California.
Latest CDMO News From Around the Web
Below are the latest news stories about AVID BIOSERVICES INC that investors may wish to consider to help them evaluate CDMO as an investment opportunity.
Insider Buying: Director Joseph Carleone Acquires 20,000 Shares of Avid Bioservices Inc (CDMO)On September 21, 2023, Director Joseph Carleone made a significant investment in Avid Bioservices Inc (NASDAQ:CDMO), purchasing 20,000 shares of the company. |
Avid Bioservices, Inc. (NASDAQ:CDMO) Q1 2024 Earnings Call TranscriptAvid Bioservices, Inc. (NASDAQ:CDMO) Q1 2024 Earnings Call Transcript September 7, 2023 Avid Bioservices, Inc. beats earnings expectations. Reported EPS is $0.03, expectations were $-0.04. Operator: Good day, ladies and gentlemen and welcome to the Avid Bioservices First Quarter 2024 Financial Results Conference Call. [Operator Instructions] As a reminder, this conference call may be recorded. […] |
Q1 2024 Avid Bioservices Inc Earnings CallQ1 2024 Avid Bioservices Inc Earnings Call |
Avid Bioservices (CDMO) Reports Break-Even Earnings for Q1Avid Bioservices (CDMO) delivered earnings and revenue surprises of 100% and 10.96%, respectively, for the quarter ended July 2023. Do the numbers hold clues to what lies ahead for the stock? |
Avid Bioservices: Fiscal Q1 Earnings SnapshotTUSTIN, Calif. (AP) — Avid Bioservices Inc. (CDMO) on Thursday reported a fiscal first-quarter loss of $2.1 million, after reporting a profit in the same period a year earlier. On a per-share basis, the Tustin, California-based company said it had a loss of 3 cents. Avid Bioservices expects full-year revenue in the range of $145 million to $165 million. |
CDMO Price Returns
1-mo | -19.44% |
3-mo | -26.12% |
6-mo | -47.79% |
1-year | -45.96% |
3-year | 29.33% |
5-year | 40.58% |
YTD | -29.56% |
2022 | -52.81% |
2021 | 152.86% |
2020 | 50.46% |
2019 | 87.07% |
2018 | 5.67% |
Continue Researching CDMO
Want to do more research on Avid Bioservices Inc's stock and its price? Try the links below:Avid Bioservices Inc (CDMO) Stock Price | Nasdaq
Avid Bioservices Inc (CDMO) Stock Quote, History and News - Yahoo Finance
Avid Bioservices Inc (CDMO) Stock Price and Basic Information | MarketWatch
Loading social stream, please wait...