Celanese Corp. (CE): Price and Financial Metrics

Celanese Corp. (CE): $162.31

2.26 (+1.41%)

POWR Rating

Component Grades

Momentum

D

Stability

C

Sentiment

Quality

C

Add CE to Watchlist
Sign Up

Industry: Chemicals

Industry

C

Ranked

#50 of 83

in industry

CE Price/Volume Stats

Current price $162.31 52-week high $163.82
Prev. close $160.05 52-week low $97.12
Day low $160.80 Volume 1,171,500
Day high $163.82 Avg. volume 725,519
50-day MA $149.94 Dividend yield 1.77%
200-day MA $131.46 Market Cap 17.68B

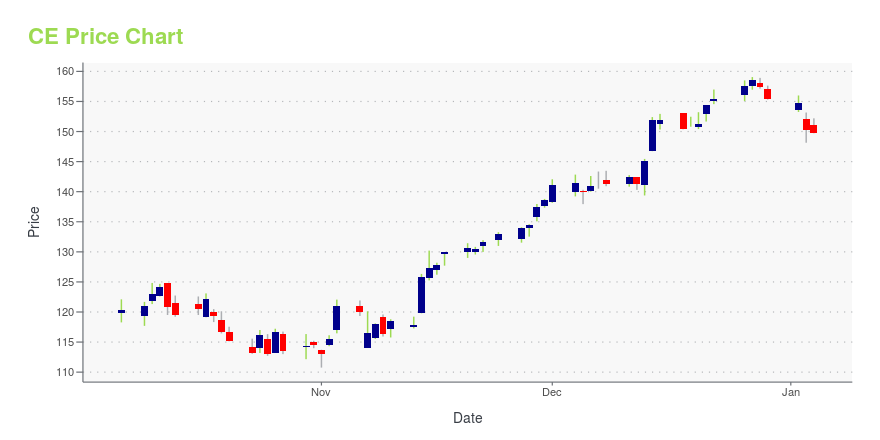
CE Stock Price Chart Interactive Chart >

CE POWR Grades

  • CE scores best on the Quality dimension, with a Quality rank ahead of 55.68% of US stocks.
  • CE's strongest trending metric is Stability; it's been moving up over the last 26 weeks.
  • CE ranks lowest in Growth; there it ranks in the 17th percentile.

CE Stock Summary

  • CE has a higher market value than 87.51% of US stocks; more precisely, its current market capitalization is $16,354,400,290.
  • Of note is the ratio of CELANESE CORP's sales and general administrative expense to its total operating expenses; 99.35% of US stocks have a lower such ratio.
  • The ratio of debt to operating expenses for CELANESE CORP is higher than it is for about 95.56% of US stocks.
  • Stocks with similar financial metrics, market capitalization, and price volatility to CELANESE CORP are ROG, TXMD, AMCR, OI, and EAF.
  • CE's SEC filings can be seen here. And to visit CELANESE CORP's official web site, go to www.celanese.com.

CE Valuation Summary

  • In comparison to the median Basic Materials stock, CE's price/earnings ratio is 50.3% lower, now standing at 8.3.
  • CE's price/earnings ratio has moved down 8.9 over the prior 231 months.

Below are key valuation metrics over time for CE.

Stock Date P/S P/B P/E EV/EBIT
CE 2023-12-29 1.6 2.6 8.3 17.6
CE 2023-12-28 1.6 2.6 8.4 17.7
CE 2023-12-27 1.6 2.7 8.5 17.8
CE 2023-12-26 1.6 2.6 8.5 17.7
CE 2023-12-22 1.6 2.6 8.3 17.6
CE 2023-12-21 1.6 2.6 8.3 17.5

CE Growth Metrics

    Its 4 year cash and equivalents growth rate is now at 13.77%.
  • Its 5 year net income to common stockholders growth rate is now at -11.26%.
  • The 3 year revenue growth rate now stands at 32.7%.
Over the past 15 months, CE's revenue has gone up $1.82e+09.

The table below shows CE's growth in key financial areas (numbers in millions of US dollars).

Date Revenue Operating Cash Flow Net Income to Common Stock
2022-12-31 9,673 1,819 1,894
2022-09-30 9,600 1,862 1,651
2022-06-30 9,565 2,025 1,966
2022-03-31 9,277 1,957 2,070
2021-12-31 8,537 1,757 1,890
2021-09-30 7,853 1,447 2,819

CE's Quality Factors

The “Quality” component of the POWR Ratings focuses on 31 different factors of a companies fundamentals and operational strength. Here are some key insights as we drill into the specifics of these quality attributes.
  • CE has a Quality Grade of B, ranking ahead of 93.59% of graded US stocks.
  • CE's asset turnover comes in at 0.706 -- ranking 39th of 89 Chemicals stocks.
  • WLK, EMN, and FF are the stocks whose asset turnover ratios are most correlated with CE.

The table below shows CE's key quality metrics over time.

Period Asset Turnover Gross Margin ROIC
2021-09-30 0.706 0.298 0.316
2021-06-30 0.656 0.279 0.291
2021-03-31 0.586 0.239 0.247
2020-12-31 0.569 0.229 0.237
2020-09-30 0.574 0.224 0.083
2020-06-30 0.598 0.233 0.091

CE Price Target

For more insight on analysts targets of CE, see our CE price target page. And for a list of of all stocks sorted by upside potential based on analyst target price, see our Top Price Target page.

Average Price Target $178.09 Average Broker Recommendation 1.57 (Moderate Buy)

Celanese Corp. (CE) Company Bio


Celanese Corporation, formerly known as Hoechst Celanese, is an American technology and specialty materials company headquartered in IrvingTexas, United States.  Part of the Fortune 500, the company is the world’s leading producer of acetic acid, producing about 1.95 million tonnes per year, representing approximately 25% of global production. Celanese is also the world's largest producer of vinyl acetate monomer (VAM). (Source:Wikipedia)


CE Latest News Stream


Event/Time News Detail
Loading, please wait...

CE Latest Social Stream


Loading social stream, please wait...

View Full CE Social Stream

Latest CE News From Around the Web

Below are the latest news stories about CELANESE CORP that investors may wish to consider to help them evaluate CE as an investment opportunity.

Investors Don't See Light At End Of Celanese Corporation's (NYSE:CE) Tunnel

Celanese Corporation's ( NYSE:CE ) price-to-earnings (or "P/E") ratio of 8.1x might make it look like a strong buy...

Yahoo | December 18, 2023

Celanese (CE) Rallies 48% YTD: What's Driving the Stock?

Celanese (CE) gains on its investments in organic projects, strategic acquisitions and productivity measures.

Yahoo | December 15, 2023

Celanese (CE) Scales 52-Week High: What's Driving the Stock?

Celanese (CE) gains on its productivity measures, investments in organic projects and strategic acquisitions.

Yahoo | December 8, 2023

Celanese (CE) Up 20.1% Since Last Earnings Report: Can It Continue?

Celanese (CE) reported earnings 30 days ago. What's next for the stock? We take a look at earnings estimates for some clues.

Yahoo | December 6, 2023

Is Buffett Turning Bearish? 7 Stocks Warren Completely Dumped in Q3

Warren Buffett stocks are typically bought to be held for a long time but sometimes even he finds it necessary to sell.

Rich Duprey on InvestorPlace | December 5, 2023

Read More 'CE' Stories Here

CE Price Returns

1-mo 7.45%
3-mo 7.86%
6-mo 30.87%
1-year 61.25%
3-year 17.26%
5-year 76.73%
YTD 4.95%
2023 55.69%
2022 -37.77%
2021 31.75%
2020 8.25%
2019 39.85%

CE Dividends

Ex-Dividend Date Type Payout Amount Change
Loading, please wait...
View Full CE Dividend History

Get Free Updates

Join thousands of investors who get the latest news, insights and top rated picks from StockNews.com!