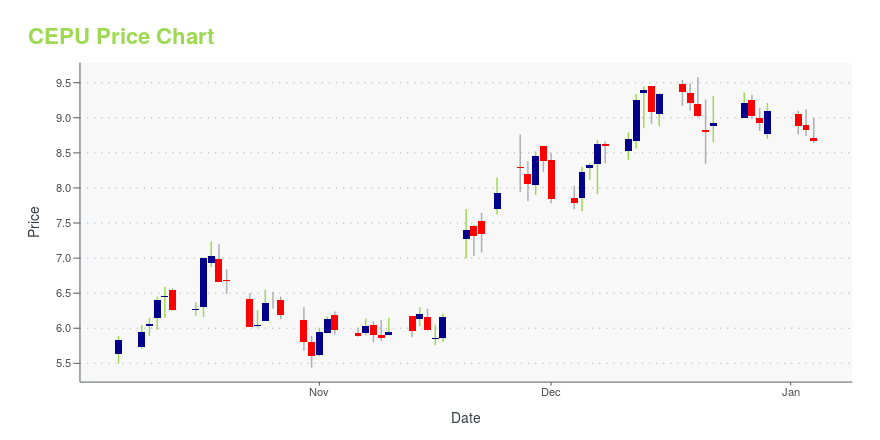
Central Puerto S.A. ADR (CEPU): Price and Financial Metrics
CEPU Price/Volume Stats
| Current price | $11.70 | 52-week high | $16.60 |
| Prev. close | $12.22 | 52-week low | $7.07 |
| Day low | $11.70 | Volume | 111,100 |
| Day high | $12.42 | Avg. volume | 318,805 |
| 50-day MA | $11.95 | Dividend yield | 2.65% |
| 200-day MA | $12.25 | Market Cap | 1.77B |
CEPU Stock Price Chart Interactive Chart >
Central Puerto S.A. ADR (CEPU) Company Bio
Central Puerto S.A. generates and sells electric power to private and public customers in Argentina. The company generates power through thermal, gas, and wind power plants with a total installed capacity of 3,791 MW. It also delivers steam to private customers through cogeneration cycles. The company was founded in 1989 and is based in Buenos Aires, Argentina
CEPU Price Returns
| 1-mo | -13.78% |
| 3-mo | -5.49% |
| 6-mo | N/A |
| 1-year | 32.41% |
| 3-year | 307.06% |
| 5-year | 388.15% |
| YTD | -19.25% |
| 2024 | 64.13% |
| 2023 | 55.41% |
| 2022 | 93.84% |
| 2021 | 15.93% |
| 2020 | -44.44% |
CEPU Dividends
| Ex-Dividend Date | Type | Payout Amount | Change | ||||||
|---|---|---|---|---|---|---|---|---|---|
| Loading, please wait... | |||||||||
Continue Researching CEPU
Want to see what other sources are saying about Central Puerto Sa's financials and stock price? Try the links below:Central Puerto Sa (CEPU) Stock Price | Nasdaq
Central Puerto Sa (CEPU) Stock Quote, History and News - Yahoo Finance
Central Puerto Sa (CEPU) Stock Price and Basic Information | MarketWatch


Loading social stream, please wait...