CEVA, Inc. (CEVA): Price and Financial Metrics
GET POWR RATINGS... FREE!
CEVA Price/Volume Stats
Current price | $24.22 | 52-week high | $39.20 |
Prev. close | $22.29 | 52-week low | $20.51 |
Day low | $22.42 | Volume | 118,500 |
Day high | $24.24 | Avg. volume | 112,854 |
50-day MA | $26.25 | Dividend yield | N/A |
200-day MA | $28.44 | Market Cap | 567.14M |
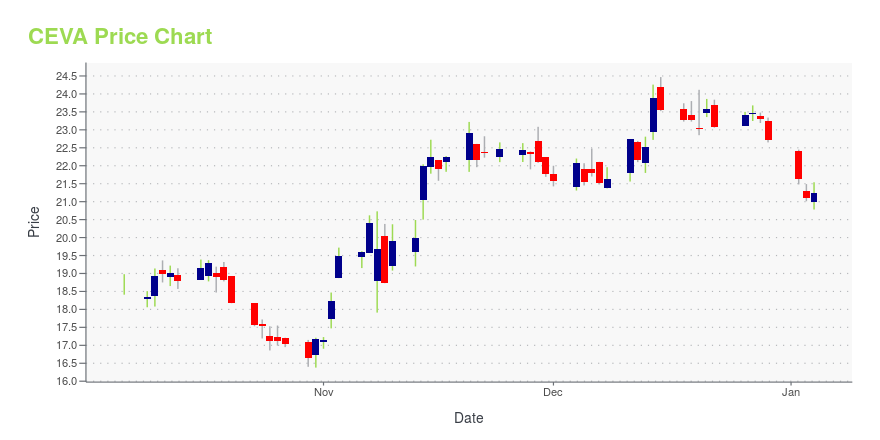
CEVA Stock Price Chart Interactive Chart >
CEVA POWR Grades
- Momentum is the dimension where CEVA ranks best; there it ranks ahead of 84.47% of US stocks.
- CEVA's strongest trending metric is Growth; it's been moving up over the last 179 days.
- CEVA ranks lowest in Sentiment; there it ranks in the 20th percentile.
CEVA Stock Summary
- Of note is the ratio of CEVA INC's sales and general administrative expense to its total operating expenses; just 11.22% of US stocks have a lower such ratio.
- Equity multiplier, or assets relative to shareholders' equity, comes in at 1.18 for CEVA INC; that's greater than it is for merely 12.74% of US stocks.
- In terms of twelve month growth in earnings before interest and taxes, CEVA INC is reporting a growth rate of -223.95%; that's higher than merely 7.32% of US stocks.
- Stocks that are quantitatively similar to CEVA, based on their financial statements, market capitalization, and price volatility, are STRO, RARE, CLDX, ALGS, and RXRX.
- CEVA's SEC filings can be seen here. And to visit CEVA INC's official web site, go to www.ceva-dsp.com.
CEVA Valuation Summary
- CEVA's EV/EBIT ratio is -62.6; this is 395.98% lower than that of the median Technology stock.
- CEVA's EV/EBIT ratio has moved down 60.8 over the prior 243 months.
Below are key valuation metrics over time for CEVA.
Stock | Date | P/S | P/B | P/E | EV/EBIT |
---|---|---|---|---|---|
CEVA | 2023-05-22 | 4.1 | 2.0 | -20.0 | -62.6 |
CEVA | 2023-05-19 | 4.0 | 2.0 | -19.4 | -60.5 |
CEVA | 2023-05-18 | 3.9 | 2.0 | -19.3 | -60.3 |
CEVA | 2023-05-17 | 3.9 | 1.9 | -19.0 | -59.5 |
CEVA | 2023-05-16 | 3.9 | 1.9 | -18.9 | -59.2 |
CEVA | 2023-05-15 | 3.9 | 1.9 | -19.2 | -60.0 |
CEVA Growth Metrics
- Its 5 year revenue growth rate is now at 21.14%.
- Its 3 year price growth rate is now at 44.2%.
- Its 4 year price growth rate is now at -22.13%.

The table below shows CEVA's growth in key financial areas (numbers in millions of US dollars).
Date | Revenue | Operating Cash Flow | Net Income to Common Stock |
---|---|---|---|
2022-09-30 | 135.303 | 14.496 | -21.245 |
2022-06-30 | 134.433 | 19.084 | 0.892 |
2022-03-31 | 131.695 | 20.435 | 2.33 |
2021-12-31 | 122.706 | 25.804 | 0.396 |
2021-09-30 | 116.794 | 21.659 | -2.847 |
2021-06-30 | 108.964 | 10.973 | -3.419 |
CEVA's Quality Factors
The “Quality” component of the POWR Ratings focuses on 31 different factors of a companies fundamentals and operational strength. Here are some key insights as we drill into the specifics of these quality attributes.- CEVA has a Quality Grade of C, ranking ahead of 71.62% of graded US stocks.
- CEVA's asset turnover comes in at 0.353 -- ranking 165th of 208 Electronic Equipment stocks.
- ESE, PWFL, and EMKR are the stocks whose asset turnover ratios are most correlated with CEVA.
The table below shows CEVA's key quality metrics over time.
Period | Asset Turnover | Gross Margin | ROIC |
---|---|---|---|
2021-06-30 | 0.353 | 0.898 | 0.025 |
2021-03-31 | 0.335 | 0.898 | 0.011 |
2020-12-31 | 0.334 | 0.893 | 0.013 |
2020-09-30 | 0.338 | 0.890 | 0.020 |
2020-06-30 | 0.335 | 0.885 | 0.017 |
2020-03-31 | 0.320 | 0.884 | 0.014 |
CEVA Price Target
For more insight on analysts targets of CEVA, see our CEVA price target page. And for a list of of all stocks sorted by upside potential based on analyst target price, see our Top Price Target page.
Average Price Target | $60.29 | Average Broker Recommendation | 1.57 (Moderate Buy) |
CEVA, Inc. (CEVA) Company Bio
Ceva Inc. is a licensor of cellular, multimedia and connectivity technologies to semiconductor companies and OEMs serving the mobile, consumer, automotive and IoT markets. The company was founded in 1999 and is based in Mountain View, California.
Latest CEVA News From Around the Web
Below are the latest news stories about CEVA INC that investors may wish to consider to help them evaluate CEVA as an investment opportunity.
CEVA and proteanTecs Announce Partnership to Optimize Reliability and Power of Complex SoCsTEL AVIV, Israel, May 22, 2023--ECOMOTION – proteanTecs, a global leader of deep data analytics for advanced electronics, and CEVA, Inc. (NASDAQ: CEVA), the leading licensor of wireless connectivity and smart sensing technologies and custom SoC solutions, have announced a partnership to enhance the reliability and power/performance of advanced chips by combining CEVA’s leading IP platforms with proteanTecs’ deep data analytics. |
CEVA to Participate at the 51st Annual TD Cowen Technology, Media & Telecom ConferenceCEVA, Inc. (NASDAQ: CEVA), the leading licensor of wireless connectivity and smart sensing technologies and custom SoC solutions, today announced that CEVA management will participate in the 51st Annual TD Cowen Technology, Media & Telecom Conference on May 31, 2023. The conference will be held at the Lotte New York Palace Hotel in New York City. To request a meeting, please contact a TD Cowen sales representative. |
Investor Optimism Abounds CEVA, Inc. (NASDAQ:CEVA) But Growth Is LackingWhen close to half the companies in the Semiconductor industry in the United States have price-to-sales ratios (or... |
Ceva (CEVA) Reports Break-Even Earnings for Q1Ceva (CEVA) delivered earnings and revenue surprises of -100% and 7.81%, respectively, for the quarter ended March 2023. Do the numbers hold clues to what lies ahead for the stock? |
CEVA Acquires Spatial Audio Business from VisiSonics to Expand its Application Software Portfolio for Embedded Systems targeting Hearables and other Consumer IoT MarketsCEVA, Inc. (NASDAQ: CEVA), the leading licensor of wireless connectivity and smart sensing technologies and custom SoC solutions, today announced the acquisition of the RealSpace® 3D Spatial Audio business, technology and patents from VisiSonics Corporation. Based in Maryland, close to CEVA's sensor fusion R&D development center, the VisiSonics spatial audio R&D team and software extend the Company's application software portfolio for embedded systems, bolstering CEVA's strong market position in |
CEVA Price Returns
1-mo | -3.62% |
3-mo | -23.26% |
6-mo | -10.86% |
1-year | -34.79% |
3-year | -29.74% |
5-year | -28.76% |
YTD | -5.32% |
2022 | -40.84% |
2021 | -4.97% |
2020 | 68.77% |
2019 | 22.05% |
2018 | -52.13% |
Continue Researching CEVA
Here are a few links from around the web to help you further your research on Ceva Inc's stock as an investment opportunity:Ceva Inc (CEVA) Stock Price | Nasdaq
Ceva Inc (CEVA) Stock Quote, History and News - Yahoo Finance
Ceva Inc (CEVA) Stock Price and Basic Information | MarketWatch
Loading social stream, please wait...