
CF Industries Holdings Inc. (CF): Price and Financial Metrics
CF Price/Volume Stats
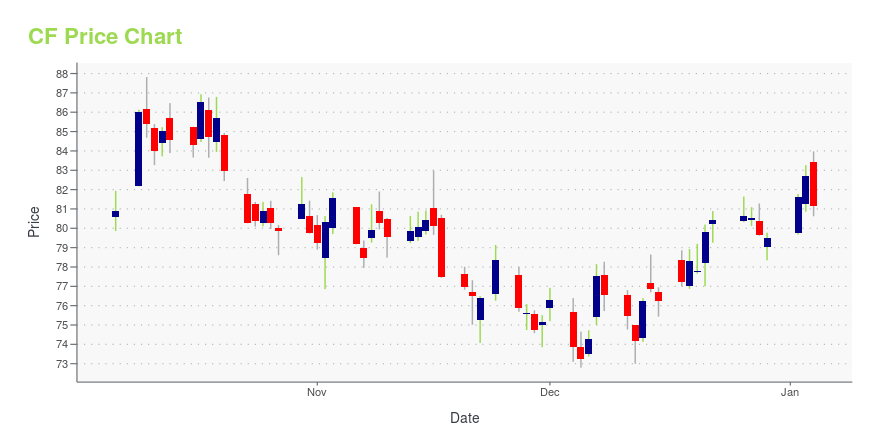
| Current price | $75.04 | 52-week high | $87.90 |
| Prev. close | $73.51 | 52-week low | $69.13 |
| Day low | $73.70 | Volume | 1,668,500 |
| Day high | $75.14 | Avg. volume | 2,304,657 |
| 50-day MA | $74.63 | Dividend yield | 2.84% |
| 200-day MA | $78.15 | Market Cap | 13.72B |
CF Stock Price Chart Interactive Chart >
CF Industries Holdings Inc. (CF) Company Bio
CF Industries Holdings, Inc. is an American manufacturer and distributor of agricultural fertilizers, including ammonia, urea, and ammonium nitrate products, based in Deerfield, Illinois, a suburb of Chicago. It was founded in 1946 as the Central Farmers Fertilizer Company. For its first 56 years, it was a federation of regional agricultural supply cooperatives. CF then demutualized, and became a publicly traded company. (Source:Wikipedia)
Latest CF News From Around the Web
Below are the latest news stories about CF INDUSTRIES HOLDINGS INC that investors may wish to consider to help them evaluate CF as an investment opportunity.
Dow, Nasdaq Back Up Again As Treasury Yields TumbleThough the major indexes yesterday came back down to earth, snapping impressive win streaks amid a selloff, they are on their way up again this afternoon. |
Why You Should Retain CF Industries (CF) in Your PortfolioWhile CF Industries (CF) remains exposed to headwinds from softer nitrogen prices, it benefits from healthy global demand for nitrogen fertilizers and lower natural gas costs. |
Fertilizer Industry Sway to Face Scrutiny in US Bill Backed by Farmers(Bloomberg) -- After cracking down on concentration in the meat industry, US senators now want the government to scrutinize the power of fertilizer companies.Most Read from BloombergJPMorgan Is in a Fight Over Its Client’s Lost $50 Million FortuneRaimondo Vows ‘Strongest Possible’ Action on Huawei’s Chip BreakthroughGoldman Trader Who Was Paid $100 Million Since 2020 to Step DownAbu Dhabi Is the World’s Newest Wealth Haven for BillionairesHarvard’s Deepening Disunity Pits Alumni Against FacultyA |
Why CF Industries Holdings, Inc. (NYSE:CF) Could Be Worth WatchingCF Industries Holdings, Inc. ( NYSE:CF ) saw significant share price movement during recent months on the NYSE, rising... |
17 Most Profitable Crops to Grow in the USIn this article, we will be analyzing the agriculture sector in the US and covering the 17 most profitable crops to grow in the country. If you wish to skip our detailed analysis, you can move directly to the 5 Most Profitable Crops to Grow in the US. Outlook of the US Agriculture Sector As […] |
CF Price Returns
| 1-mo | -1.55% |
| 3-mo | -5.56% |
| 6-mo | -1.87% |
| 1-year | -5.73% |
| 3-year | 68.30% |
| 5-year | 76.40% |
| YTD | -4.35% |
| 2023 | -4.75% |
| 2022 | 22.29% |
| 2021 | 87.18% |
| 2020 | -15.76% |
| 2019 | 12.73% |
CF Dividends
| Ex-Dividend Date | Type | Payout Amount | Change | ||||||
|---|---|---|---|---|---|---|---|---|---|
| Loading, please wait... | |||||||||
Continue Researching CF
Here are a few links from around the web to help you further your research on CF Industries Holdings Inc's stock as an investment opportunity:CF Industries Holdings Inc (CF) Stock Price | Nasdaq
CF Industries Holdings Inc (CF) Stock Quote, History and News - Yahoo Finance
CF Industries Holdings Inc (CF) Stock Price and Basic Information | MarketWatch
Loading social stream, please wait...