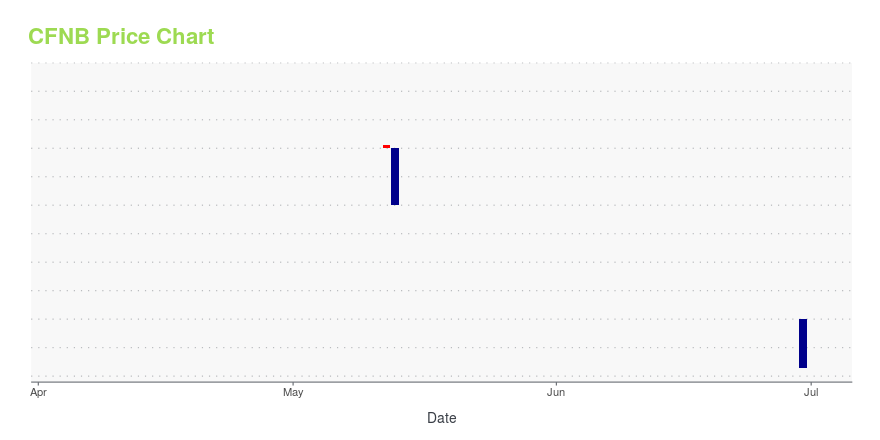
Warning: This security is no longer trading.
defunct
California First National Bancorp (CFNB): Price and Financial Metrics
GET POWR RATINGS... FREE!
CFNB Stock Summary
- CALIFORNIA FIRST LEASING Corp's capital turnover -- a measure of revenue relative to shareholder's equity -- is better than merely 14.18% of US listed stocks.
- CALIFORNIA FIRST LEASING Corp's stock had its IPO on April 9, 1987, making it an older stock than 91.92% of US equities in our set.
- The volatility of CALIFORNIA FIRST LEASING Corp's share price is greater than that of merely 0.02% US stocks with at least 200 days of trading history.
- Stocks with similar financial metrics, market capitalization, and price volatility to CALIFORNIA FIRST LEASING Corp are TRST, KRNY, ASB, FNB, and HWBK.
- To dig deeper into the stock's financial statements, go to CFNB's page on browse-edgar?action=getcompany&CIK=0000803016.
CFNB Valuation Summary
- CFNB's price/sales ratio is 6.5; this is 103.12% higher than that of the median Financial Services stock.
- CFNB's price/earnings ratio has moved up 8.5 over the prior 243 months.
- CFNB's price/sales ratio has moved up 4.6 over the prior 243 months.
Below are key valuation metrics over time for CFNB.
Stock | Date | P/S | P/B | P/E | EV/EBIT |
---|---|---|---|---|---|
CFNB | 2020-06-24 | 5.4 | 0.8 | 14.1 | 5.4 |
CFNB | 2016-10-17 | 5.8 | 0.8 | 16.6 | 5.9 |
CFNB | 2016-09-20 | 7.0 | 0.8 | 23.8 | 12.8 |
CFNB | 2013-04-15 | 7.1 | 1.0 | 22.6 | 9.7 |
CFNB | 2004-09-10 | 4.1 | 0.7 | 14.6 | 6.4 |
CFNB | 2001-12-28 | 2.0 | 0.7 | 8.6 | 7.5 |
CFNB Stock Price Chart Interactive Chart >
CFNB Price/Volume Stats
Current price | $17.75 | 52-week high | $18.65 |
Prev. close | $18.00 | 52-week low | $17.75 |
Day low | $17.75 | Volume | 100 |
Day high | $17.75 | Avg. volume | 883 |
50-day MA | $18.18 | Dividend yield | 3.15% |
200-day MA | $0.00 | Market Cap | 182.47M |
California First National Bancorp (CFNB) Company Bio
California First National Bancorp provides banking services in California. The company was founded in 1977 and is based in Irvine, California.
CFNB Price Returns
1-mo | N/A |
3-mo | N/A |
6-mo | N/A |
1-year | 0.87% |
3-year | 26.44% |
5-year | 17.85% |
YTD | -1.39% |
2021 | 22.61% |
2020 | -5.78% |
2019 | 17.67% |
2018 | -3.14% |
2017 | -0.52% |
CFNB Dividends
Ex-Dividend Date | Type | Payout Amount | Change | ||||||
---|---|---|---|---|---|---|---|---|---|
Loading, please wait... |
Loading social stream, please wait...