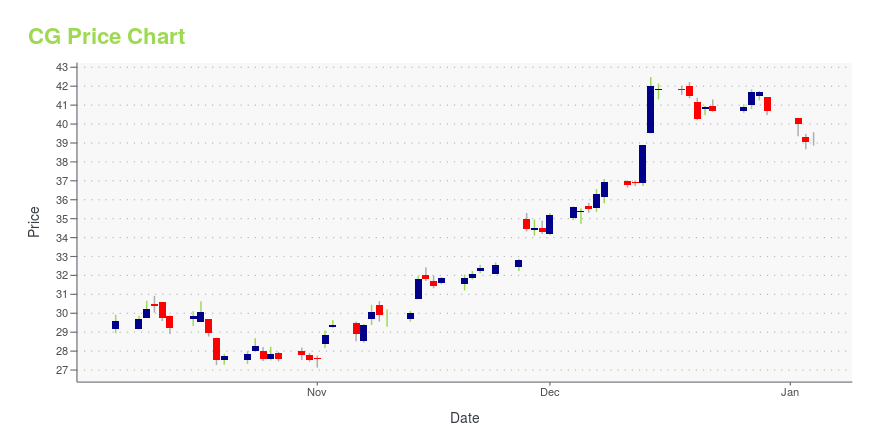
Carlyle Group Inc. (CG): Price and Financial Metrics
CG Price/Volume Stats
| Current price | $55.24 | 52-week high | $55.65 |
| Prev. close | $54.27 | 52-week low | $36.65 |
| Day low | $54.61 | Volume | 1,709,700 |
| Day high | $55.65 | Avg. volume | 1,999,945 |
| 50-day MA | $52.05 | Dividend yield | 2.58% |
| 200-day MA | $45.66 | Market Cap | 19.76B |
CG Stock Price Chart Interactive Chart >
Carlyle Group Inc. (CG) Company Bio
The Carlyle Group is a multinational private equity, alternative asset management and financial services corporation based in the United States with $376 billion of assets under management. It specializes in private equity, real assets, and private credit. It is one of the largest mega-funds in the world. In 2015, Carlyle was the world's largest private equity firm by capital raised over the previous five years, according to the PEI 300 index, though by 2020, it had slipped into second place. (Source:Wikipedia)
CG Price Returns
| 1-mo | 10.00% |
| 3-mo | 12.95% |
| 6-mo | 21.07% |
| 1-year | 42.84% |
| 3-year | 25.56% |
| 5-year | 89.60% |
| YTD | 9.41% |
| 2024 | 28.05% |
| 2023 | 42.55% |
| 2022 | -43.78% |
| 2021 | 78.46% |
| 2020 | 1.62% |
CG Dividends
| Ex-Dividend Date | Type | Payout Amount | Change | ||||||
|---|---|---|---|---|---|---|---|---|---|
| Loading, please wait... | |||||||||
Continue Researching CG
Want to do more research on Carlyle Group Inc's stock and its price? Try the links below:Carlyle Group Inc (CG) Stock Price | Nasdaq
Carlyle Group Inc (CG) Stock Quote, History and News - Yahoo Finance
Carlyle Group Inc (CG) Stock Price and Basic Information | MarketWatch


Loading social stream, please wait...