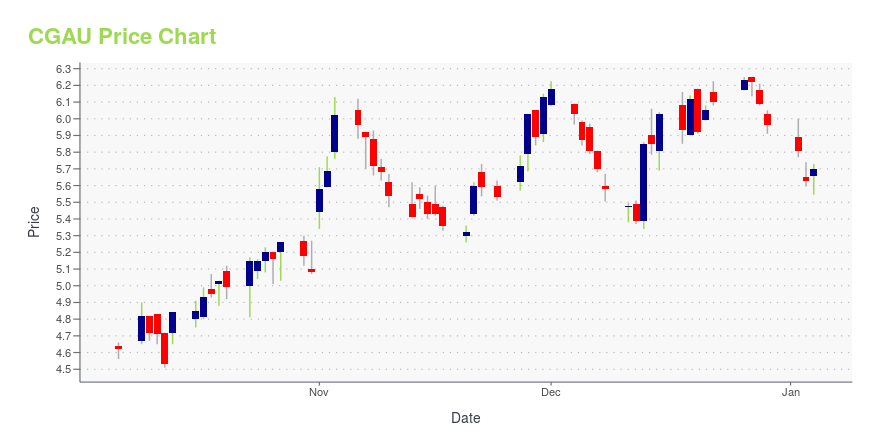
Centerra Gold Inc. (CGAU): Price and Financial Metrics
CGAU Price/Volume Stats
| Current price | $6.56 | 52-week high | $7.51 |
| Prev. close | $6.48 | 52-week low | $4.47 |
| Day low | $6.47 | Volume | 869,438 |
| Day high | $6.65 | Avg. volume | 494,098 |
| 50-day MA | $6.87 | Dividend yield | 3.03% |
| 200-day MA | $5.95 | Market Cap | 1.40B |
CGAU Stock Price Chart Interactive Chart >
Centerra Gold Inc. (CGAU) Company Bio
Centerra Gold Inc., a gold mining company, engages in the acquisition, exploration, development, and operation of gold and copper properties in North America, Asia, and internationally. Its flagship projects include the 100% owned Kumtor gold mine located in the Kyrgyz Republic; the Mount Milligan gold-copper mine located in British Columbia, Canada; and the Ãksüt Gold Mine located in Turkey. The company was incorporated in 2002 and is headquartered in Toronto, Canada.
Latest CGAU News From Around the Web
Below are the latest news stories about CENTERRA GOLD INC that investors may wish to consider to help them evaluate CGAU as an investment opportunity.
Centerra Gold Inc.'s (TSE:CG) institutional investors lost 7.2% last week but have benefitted from longer-term gainsKey Insights Significantly high institutional ownership implies Centerra Gold's stock price is sensitive to their... |
Shareholders in Centerra Gold (TSE:CG) are in the red if they invested three years agoIn order to justify the effort of selecting individual stocks, it's worth striving to beat the returns from a market... |
Centerra Gold (TSE:CG) Will Pay A Dividend Of $0.07The board of Centerra Gold Inc. ( TSE:CG ) has announced that it will pay a dividend of $0.07 per share on the 29th of... |
Centerra Gold Announces TSX Acceptance of Renewed Normal Course Issuer BidTORONTO, Nov. 03, 2023 (GLOBE NEWSWIRE) -- Centerra Gold Inc. (TSX: CG) (NYSE: CGAU) (“Centerra” or the “Company”) is pleased to announce that the Toronto Stock Exchange (“TSX”) has accepted its renewal of a normal course issuer bid (“NCIB”) to purchase for cancellation up to an aggregate of 18,293,896 common shares in the capital of the Company (“Common Shares”) during the twelve-month period commencing on November 7, 2023 and ending on November 6, 2024, representing approximately 8.48% of Cent |
IAG or CGAU: Which Is the Better Value Stock Right Now?IAG vs. CGAU: Which Stock Is the Better Value Option? |
CGAU Price Returns
| 1-mo | -3.53% |
| 3-mo | 3.88% |
| 6-mo | 23.70% |
| 1-year | 13.72% |
| 3-year | -5.96% |
| 5-year | -10.92% |
| YTD | 11.87% |
| 2023 | 19.38% |
| 2022 | -30.23% |
| 2021 | -32.75% |
| 2020 | 45.91% |
| 2019 | 87.71% |
CGAU Dividends
| Ex-Dividend Date | Type | Payout Amount | Change | ||||||
|---|---|---|---|---|---|---|---|---|---|
| Loading, please wait... | |||||||||


Loading social stream, please wait...