The Chefs' Warehouse, Inc. (CHEF): Price and Financial Metrics
GET POWR RATINGS... FREE!
CHEF POWR Grades
- CHEF scores best on the Growth dimension, with a Growth rank ahead of 93.13% of US stocks.
- CHEF's strongest trending metric is Stability; it's been moving up over the last 179 days.
- CHEF ranks lowest in Value; there it ranks in the 14th percentile.
CHEF Stock Summary
- Chefs' Warehouse Inc's capital turnover -- a measure of revenue relative to shareholder's equity -- is better than 92.16% of US listed stocks.
- CHEF's one year PEG ratio, measuring expected growth in earnings next year relative to current common stock price is 230.32 -- higher than 89.16% of US-listed equities with positive expected earnings growth.
- Of note is the ratio of Chefs' Warehouse Inc's sales and general administrative expense to its total operating expenses; 85.21% of US stocks have a lower such ratio.
- If you're looking for stocks that are quantitatively similar to Chefs' Warehouse Inc, a group of peers worth examining would be SRCL, SSNT, CALM, MRC, and STRR.
- Visit CHEF's SEC page to see the company's official filings. To visit the company's web site, go to www.chefswarehouse.com.
CHEF Valuation Summary
- CHEF's EV/EBIT ratio is -19.5; this is 208.33% lower than that of the median Consumer Defensive stock.
- CHEF's price/sales ratio has moved down 0.1 over the prior 123 months.
- Over the past 123 months, CHEF's price/sales ratio has gone down 0.1.
Below are key valuation metrics over time for CHEF.
Stock | Date | P/S | P/B | P/E | EV/EBIT |
---|---|---|---|---|---|
CHEF | 2021-09-03 | 0.9 | 3.3 | -16.9 | -19.5 |
CHEF | 2021-09-02 | 0.9 | 3.4 | -17.3 | -19.9 |
CHEF | 2021-09-01 | 0.9 | 3.4 | -17.4 | -19.9 |
CHEF | 2021-08-31 | 0.9 | 3.4 | -17.6 | -20.1 |
CHEF | 2021-08-30 | 0.9 | 3.4 | -17.3 | -19.9 |
CHEF | 2021-08-27 | 0.9 | 3.4 | -17.6 | -20.1 |
CHEF Growth Metrics
- Its 4 year net income to common stockholders growth rate is now at -44.72%.
- Its 2 year net income to common stockholders growth rate is now at -45.78%.
- Its 5 year cash and equivalents growth rate is now at 6949.8%.

The table below shows CHEF's growth in key financial areas (numbers in millions of US dollars).
Date | Revenue | Operating Cash Flow | Net Income to Common Stock |
---|---|---|---|
2021-12-31 | 1,745.757 | -19.899 | -4.923 |
2021-09-30 | 1,469.18 | -37.318 | -50.424 |
2021-06-30 | 1,238.889 | -28.62 | -65.307 |
2021-03-31 | 1,016.417 | 9.233 | -86.739 |
2020-12-31 | 1,111.631 | 42.881 | -82.903 |
2020-09-30 | 1,256.464 | 75.331 | -34.958 |
CHEF's Quality Factors
The “Quality” component of the POWR Ratings focuses on 31 different factors of a companies fundamentals and operational strength. Here are some key insights as we drill into the specifics of these quality attributes.- CHEF has a Quality Grade of C, ranking ahead of 35.66% of graded US stocks.
- CHEF's asset turnover comes in at 1.477 -- ranking 53rd of 105 Wholesale stocks.
- INT, DLA, and MSM are the stocks whose asset turnover ratios are most correlated with CHEF.
The table below shows CHEF's key quality metrics over time.
Period | Asset Turnover | Gross Margin | ROIC |
---|---|---|---|
2021-09-24 | 1.477 | 0.220 | -0.061 |
2021-06-25 | 1.245 | 0.221 | -0.087 |
2021-03-26 | 1.015 | 0.221 | -0.121 |
2020-12-25 | 1.072 | 0.223 | -0.112 |
2020-09-25 | 1.200 | 0.244 | -0.039 |
2020-06-26 | 1.383 | 0.249 | -0.015 |
CHEF Price Target
For more insight on analysts targets of CHEF, see our CHEF price target page. And for a list of of all stocks sorted by upside potential based on analyst target price, see our Top Price Target page.
Average Price Target | $38.80 | Average Broker Recommendation | 1.42 (Moderate Buy) |
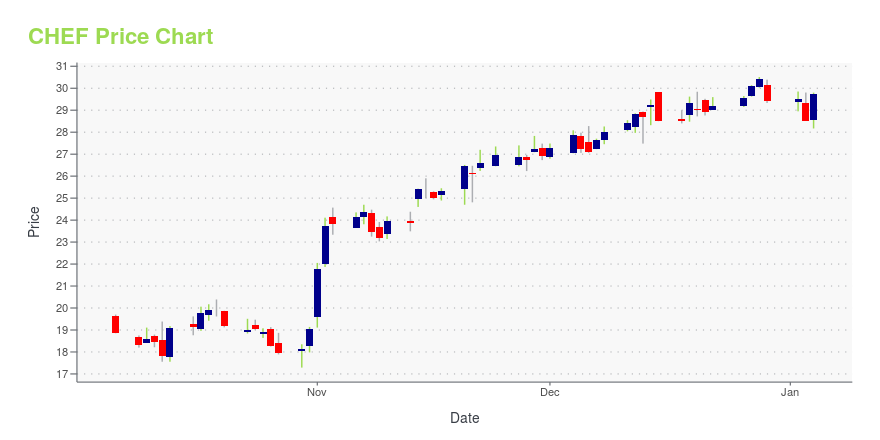
CHEF Stock Price Chart Interactive Chart >
CHEF Price/Volume Stats
Current price | $38.89 | 52-week high | $42.16 |
Prev. close | $38.98 | 52-week low | $25.60 |
Day low | $37.81 | Volume | 619,900 |
Day high | $39.86 | Avg. volume | 279,241 |
50-day MA | $35.71 | Dividend yield | N/A |
200-day MA | $33.04 | Market Cap | 1.49B |
The Chefs' Warehouse, Inc. (CHEF) Company Bio
The Chef's Warehouse is a distributor of specialty food products in the United States and Canada focused on serving the specific needs of chefs who own and/or operate some of the nation's independent restaurants, fine dining establishments, country clubs, hotels, caterers, culinary schools, bakeries, patisseries, chocolatiers, cruise lines, casinos and specialty food stores. The company was founded in 1985 and is based in Ridgefield, Connecticut.
Latest CHEF News From Around the Web
Below are the latest news stories about Chefs' Warehouse Inc that investors may wish to consider to help them evaluate CHEF as an investment opportunity.
Lake Street Reaffirms Their Buy Rating on The Chefs’ Warehouse (CHEF)Lake Street analyst Ben Klieve reiterated a Buy rating on The Chefs' Warehouse (CHEF – Research Report) today and set a price target of $45.00. The company's shares closed last Wednesday at $34.96. Klieve has an average return of 125.4% when recommending The Chefs' Warehouse. According to TipRanks.com, Klieve is ranked #494 out of 7790 analysts. Currently, the analyst consensus on The Chefs' Warehouse is a Strong Buy with an average price target of $40.50, a 26.5% upside from current levels. In a report released yesterday, BTIG also reiterated a Buy rating on the stock with a $42.00 price target. |
BTIG Keeps a Buy Rating on The Chefs’ Warehouse (CHEF)In a report released yesterday, Peter Saleh from BTIG reiterated a Buy rating on The Chefs' Warehouse (CHEF – Research Report), with a price target of $42.00. The company's shares closed last Wednesday at $34.96. According to TipRanks.com, Saleh is a 5-star analyst with an average return of 18.7% and a 69.7% success rate. Saleh covers the Services sector, focusing on stocks such as Papa John's International, BurgerFi International, and Texas Roadhouse. The word on The Street in general, suggests a Strong Buy analyst consensus rating for The Chefs' Warehouse with a $39.25 average price target, a 22.6% upside from current levels. |
The Chefs'' Warehouse, Inc. (CHEF) CEO Chris Pappas On Q4 2021 Results - Earnings Call TranscriptNo summary available. |
The Chefs'' Warehouse Non-GAAP EPS of $0.26 beats by $0.07, revenue of $558.3M beats by $50.08MThe Chefs'' Warehouse press release (CHEF): Q4 Non-GAAP EPS of $0.26 beats by $0.07.Revenue of $558.3M (+98.2% Y/Y) beats by $50.08M. |
Why The Chefs'' Warehouse Stock Jumped as Much as 13.5% TodayThe specialty restaurant supply company reported earnings, and it looks like business is really starting to pick up again. |
CHEF Price Returns
1-mo | 9.80% |
3-mo | 16.89% |
6-mo | 16.79% |
1-year | 24.09% |
3-year | 14.11% |
5-year | 199.15% |
YTD | 16.79% |
2021 | 29.62% |
2020 | -32.59% |
2019 | 19.17% |
2018 | 56.00% |
2017 | 29.75% |
Continue Researching CHEF
Want to do more research on Chefs' Warehouse Inc's stock and its price? Try the links below:Chefs' Warehouse Inc (CHEF) Stock Price | Nasdaq
Chefs' Warehouse Inc (CHEF) Stock Quote, History and News - Yahoo Finance
Chefs' Warehouse Inc (CHEF) Stock Price and Basic Information | MarketWatch
Loading social stream, please wait...