Chemung Financial Corp (CHMG): Price and Financial Metrics
GET POWR RATINGS... FREE!
CHMG POWR Grades
- CHMG scores best on the Stability dimension, with a Stability rank ahead of 97.68% of US stocks.
- The strongest trend for CHMG is in Sentiment, which has been heading down over the past 160 days.
- CHMG's current lowest rank is in the Quality metric (where it is better than 18.76% of US stocks).
CHMG Stock Summary
- Of note is the ratio of CHEMUNG FINANCIAL CORP's sales and general administrative expense to its total operating expenses; 85.26% of US stocks have a lower such ratio.
- Equity multiplier, or assets relative to shareholders' equity, comes in at 13.61 for CHEMUNG FINANCIAL CORP; that's greater than it is for 95.91% of US stocks.
- The volatility of CHEMUNG FINANCIAL CORP's share price is greater than that of only 1.56% US stocks with at least 200 days of trading history.
- Stocks that are quantitatively similar to CHMG, based on their financial statements, market capitalization, and price volatility, are VBFC, NRIM, FCAP, TMP, and FNLC.
- CHMG's SEC filings can be seen here. And to visit CHEMUNG FINANCIAL CORP's official web site, go to www.chemungcanal.com.
CHMG Valuation Summary
- CHMG's price/earnings ratio is 8.1; this is 28.95% lower than that of the median Financial Services stock.
- Over the past 243 months, CHMG's price/sales ratio has gone down 0.5.
Below are key valuation metrics over time for CHMG.
Stock | Date | P/S | P/B | P/E | EV/EBIT |
---|---|---|---|---|---|
CHMG | 2023-01-23 | 2.4 | 1.4 | 8.1 | 5.4 |
CHMG | 2023-01-20 | 2.4 | 1.4 | 8.1 | 5.4 |
CHMG | 2023-01-19 | 2.4 | 1.4 | 7.9 | 5.3 |
CHMG | 2023-01-18 | 2.3 | 1.4 | 7.9 | 5.3 |
CHMG | 2023-01-17 | 2.4 | 1.4 | 8.0 | 5.3 |
CHMG | 2023-01-13 | 2.4 | 1.4 | 8.0 | 5.4 |
CHMG Growth Metrics
- Its 2 year price growth rate is now at 77.97%.
- Its year over year price growth rate is now at 5.86%.
- The 5 year cash and equivalents growth rate now stands at 14.94%.

The table below shows CHMG's growth in key financial areas (numbers in millions of US dollars).
Date | Revenue | Operating Cash Flow | Net Income to Common Stock |
---|---|---|---|
2022-09-30 | 93.569 | 41.568 | 27.798 |
2022-06-30 | 93.244 | 35.935 | 27.991 |
2022-03-31 | 91.261 | 33.24 | 26.762 |
2021-12-31 | 89.442 | 35.461 | 26.425 |
2021-09-30 | 88.954 | 35.25 | 25.204 |
2021-06-30 | 87.037 | 31.742 | 24.269 |
CHMG's Quality Factors
The “Quality” component of the POWR Ratings focuses on 31 different factors of a companies fundamentals and operational strength. Here are some key insights as we drill into the specifics of these quality attributes.- CHMG has a Quality Grade of C, ranking ahead of 30.52% of graded US stocks.
- CHMG's asset turnover comes in at 0.038 -- ranking 214th of 435 Banking stocks.
- ATAX, GFED, and BFIN are the stocks whose asset turnover ratios are most correlated with CHMG.
The table below shows CHMG's key quality metrics over time.
Period | Asset Turnover | Gross Margin | ROIC |
---|---|---|---|
2021-06-30 | 0.038 | 1 | 0.014 |
2021-03-31 | 0.038 | 1 | 0.014 |
2020-12-31 | 0.038 | 1 | 0.012 |
2020-09-30 | 0.040 | 1 | 0.012 |
2020-06-30 | 0.039 | 1 | 0.010 |
2020-03-31 | 0.040 | 1 | 0.010 |
CHMG Price Target
For more insight on analysts targets of CHMG, see our CHMG price target page. And for a list of of all stocks sorted by upside potential based on analyst target price, see our Top Price Target page.
Average Price Target | $50.33 | Average Broker Recommendation | 1.67 (Moderate Buy) |
CHMG Stock Price Chart Interactive Chart >
CHMG Price/Volume Stats
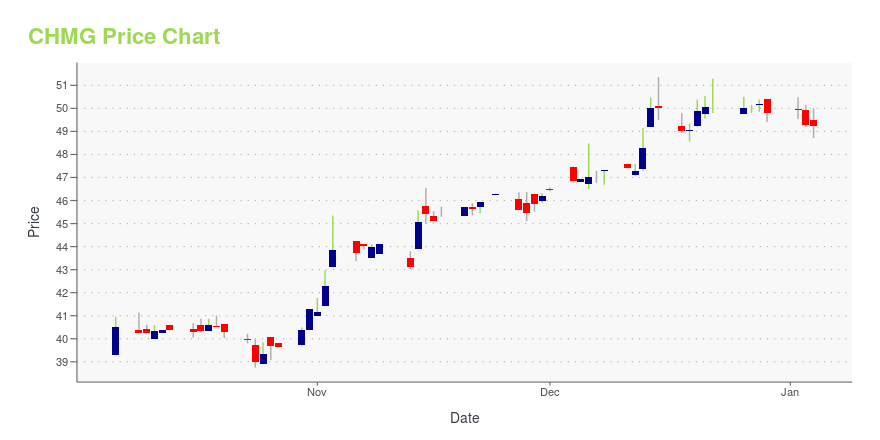
Current price | $50.98 | 52-week high | $51.60 |
Prev. close | $47.99 | 52-week low | $40.74 |
Day low | $48.50 | Volume | 10,102 |
Day high | $51.60 | Avg. volume | 15,606 |
50-day MA | $46.34 | Dividend yield | 2.58% |
200-day MA | $45.19 | Market Cap | 238.48M |
Chemung Financial Corp (CHMG) Company Bio
Chemung Financial Corporation provides a range of banking, financing, fiduciary, and other financial services primarily in New York. The company was founded in 1833 and is based in Elmira, New York.
Latest CHMG News From Around the Web
Below are the latest news stories about CHEMUNG FINANCIAL CORP that investors may wish to consider to help them evaluate CHMG as an investment opportunity.
Chemung Financial's (NASDAQ:CHMG) Dividend Will Be $0.31Chemung Financial Corporation ( NASDAQ:CHMG ) will pay a dividend of $0.31 on the 3rd of January. Based on this... |
Chemung Financial Corporation Announces Quarterly DividendELMIRA, N.Y., Nov. 16, 2022 (GLOBE NEWSWIRE) -- Chemung Financial Corporation (Nasdaq: CHMG) announced today that its Board of Directors has approved a quarterly cash dividend of $0.31 per share, payable on January 3, 2023 to common stock shareholders of record as of the close of business on December 20, 2022. Chemung Financial Corporation is a $2.6 billion financial services holding company headquartered in Elmira, New York and operates 31 offices through its principal subsidiary, Chemung Canal |
Investing in Chemung Financial (NASDAQ:CHMG) five years ago would have delivered you a 1.5% gainThe main aim of stock picking is to find the market-beating stocks. But every investor is virtually certain to have... |
Chemung Financial Corporation Reports Third Quarter 2022 Net Income of $6.5 million, or $1.37 per ShareELMIRA, N.Y., Oct. 20, 2022 (GLOBE NEWSWIRE) -- Chemung Financial Corporation (the “Corporation”) (Nasdaq: CHMG), the parent company of Chemung Canal Trust Company (the “Bank”), today reported net income of $6.5 million, or $1.37 per share, for the third quarter of 2022, compared to $6.6 million, or $1.42 per share, for the third quarter of 2021. "I am pleased to report another quarter of strong financial results for Chemung Financial Corporation, with earnings per share of $1.37," said Anders M |
Chemung Financial (CHMG) Could Be a Great ChoiceDividends are one of the best benefits to being a shareholder, but finding a great dividend stock is no easy task. Does Chemung Financial (CHMG) have what it takes? Let's find out. |
CHMG Price Returns
1-mo | 11.70% |
3-mo | 21.37% |
6-mo | 14.23% |
1-year | 13.01% |
3-year | 43.10% |
5-year | 19.59% |
YTD | 11.14% |
2022 | 1.57% |
2021 | 40.56% |
2020 | -17.11% |
2019 | 5.27% |
2018 | -12.08% |
CHMG Dividends
Ex-Dividend Date | Type | Payout Amount | Change | ||||||
---|---|---|---|---|---|---|---|---|---|
Loading, please wait... |
Continue Researching CHMG
Here are a few links from around the web to help you further your research on Chemung Financial Corp's stock as an investment opportunity:Chemung Financial Corp (CHMG) Stock Price | Nasdaq
Chemung Financial Corp (CHMG) Stock Quote, History and News - Yahoo Finance
Chemung Financial Corp (CHMG) Stock Price and Basic Information | MarketWatch
Loading social stream, please wait...