
Chewy Inc. Cl A (CHWY): Price and Financial Metrics
CHWY Price/Volume Stats
| Current price | $25.04 | 52-week high | $39.10 |
| Prev. close | $25.29 | 52-week low | $14.69 |
| Day low | $24.99 | Volume | 3,966,558 |
| Day high | $26.27 | Avg. volume | 10,319,900 |
| 50-day MA | $23.33 | Dividend yield | N/A |
| 200-day MA | $19.56 | Market Cap | 10.89B |
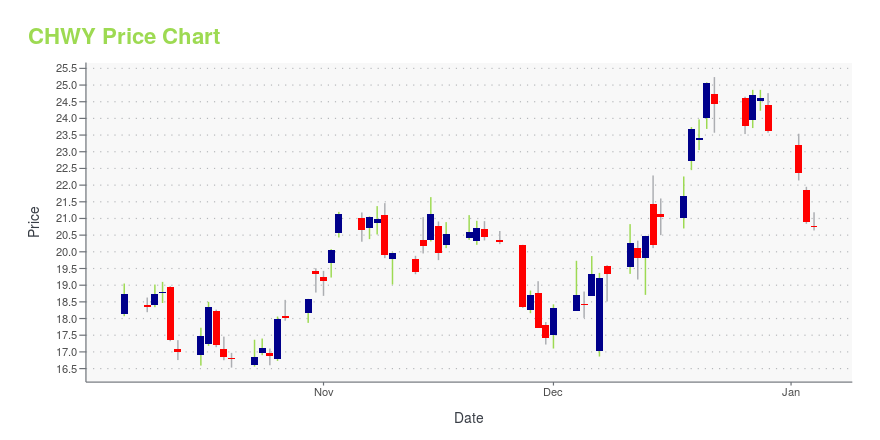
CHWY Stock Price Chart Interactive Chart >
Chewy Inc. Cl A (CHWY) Company Bio
Chewy, Inc. is an American online retailer of pet food and other pet-related products based in Dania Beach, Florida. In 2017, Chewy was acquired by PetSmart for $3.35 billion, which was the largest ever acquisition of an e-commerce business at the time. (Source:Wikipedia)
Latest CHWY News From Around the Web
Below are the latest news stories about CHEWY INC that investors may wish to consider to help them evaluate CHWY as an investment opportunity.
7 Stocks to Buy if the Fed Goes Through With Interest Rate CutsWhile inflation may have been the theme of 2022, disinflation could be the defining label for the outgoing year, thus warranting a closer examination of stocks to buy for lower interest rates. |
Pet Care Profits: 3 Stocks Benefitting from the Pet BoomThese pet care stocks tap into a booming $246.66 billion market, offering unique investment stability and growth. |
The Pandemic’s E-Commerce Stars Are CopingOnline retailers that experienced dizzying growth in 2020 and 2021 are settling into their postpandemic reality. |
Chewy Starts Crawling Out of the DoghouseSince then, Chewy's been in the doghouse. Many investors seem to have forgotten about Chewy, but it's time to start paying attention again. Technically, Chewy reached a three-month high earlier this week, after the stock successfully broke out of a double bottom pattern (black curved lines). |
3 Charts For Investors to Watch Wednesday: FedEx, Chewy, AffirmThese three stocks are worth monitoring today. We look at the reasons why and identify important chart levels to watch. |
CHWY Price Returns
| 1-mo | -14.07% |
| 3-mo | 58.08% |
| 6-mo | 29.21% |
| 1-year | -23.45% |
| 3-year | -70.66% |
| 5-year | -22.84% |
| YTD | 5.97% |
| 2023 | -36.27% |
| 2022 | -37.12% |
| 2021 | -34.40% |
| 2020 | 209.97% |
| 2019 | N/A |
Loading social stream, please wait...