
ChampionX Corporation (CHX): Price and Financial Metrics
CHX Price/Volume Stats
| Current price | $34.57 | 52-week high | $39.95 |
| Prev. close | $34.08 | 52-week low | $25.46 |
| Day low | $34.09 | Volume | 1,808,200 |
| Day high | $34.90 | Avg. volume | 1,980,312 |
| 50-day MA | $32.80 | Dividend yield | 1.09% |
| 200-day MA | $31.78 | Market Cap | 6.58B |
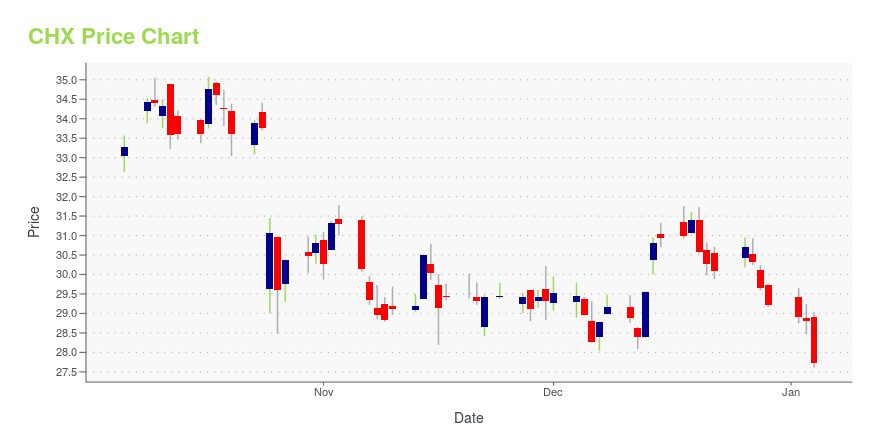
CHX Stock Price Chart Interactive Chart >
Latest CHX News From Around the Web
Below are the latest news stories about CHAMPIONX CORP that investors may wish to consider to help them evaluate CHX as an investment opportunity.
Will Weakness in ChampionX Corporation's (NASDAQ:CHX) Stock Prove Temporary Given Strong Fundamentals?With its stock down 17% over the past three months, it is easy to disregard ChampionX (NASDAQ:CHX). But if you pay... |
ChampionX Declares Quarterly DividendTHE WOODLANDS, Texas, Nov. 10, 2023 (GLOBE NEWSWIRE) -- ChampionX Corporation (Nasdaq: CHX) announced today its Board of Directors has declared a regular quarterly dividend of $0.085 per share on the company’s common stock, par value $0.01 per share, to be paid on January 26, 2024 to shareholders of record on January 5, 2024. About ChampionX ChampionX is a global leader in chemistry solutions, artificial lift systems, and highly engineered equipment and technologies that help companies drill for |
ChampionX Corp (CHX) Q3 2023 Earnings: Robust Growth and Strong Cash Flow GenerationDespite a slight revenue decrease, the company reports significant year-over-year increases in net income and adjusted EBITDA |
ChampionX Reports Third Quarter 2023 ResultsRevenue of $939.8 million, decreased 8% year-over-year and increased 1% sequentiallyNet income attributable to ChampionX of $77.7 million, increased 237% year-over-yearAdjusted net income of $80.9 million, increased 19% year-over-yearAdjusted EBITDA of $189.5 million, increased 14% year-over-yearIncome before income taxes margin of 11.7%, increased 802 basis points year-over-yearAdjusted EBITDA margin of 20.2%, increased 391 basis points year-over-yearCash from operating activities of $163.0 mil |
Is ChampionX Corporation (NASDAQ:CHX) Trading At A 20% Discount?Key Insights ChampionX's estimated fair value is US$42.05 based on 2 Stage Free Cash Flow to Equity ChampionX's... |
CHX Price Returns
| 1-mo | 6.15% |
| 3-mo | -0.55% |
| 6-mo | 22.63% |
| 1-year | 3.79% |
| 3-year | 60.17% |
| 5-year | 11.76% |
| YTD | 19.33% |
| 2023 | 1.87% |
| 2022 | 44.94% |
| 2021 | 32.09% |
| 2020 | -54.71% |
| 2019 | 24.74% |
CHX Dividends
| Ex-Dividend Date | Type | Payout Amount | Change | ||||||
|---|---|---|---|---|---|---|---|---|---|
| Loading, please wait... | |||||||||
Loading social stream, please wait...