
Cigna Corp. (CI): Price and Financial Metrics
CI Price/Volume Stats
| Current price | $343.64 | 52-week high | $365.71 |
| Prev. close | $341.15 | 52-week low | $253.95 |
| Day low | $342.49 | Volume | 1,135,600 |
| Day high | $346.66 | Avg. volume | 1,563,962 |
| 50-day MA | $335.55 | Dividend yield | 1.67% |
| 200-day MA | $324.17 | Market Cap | 97.62B |
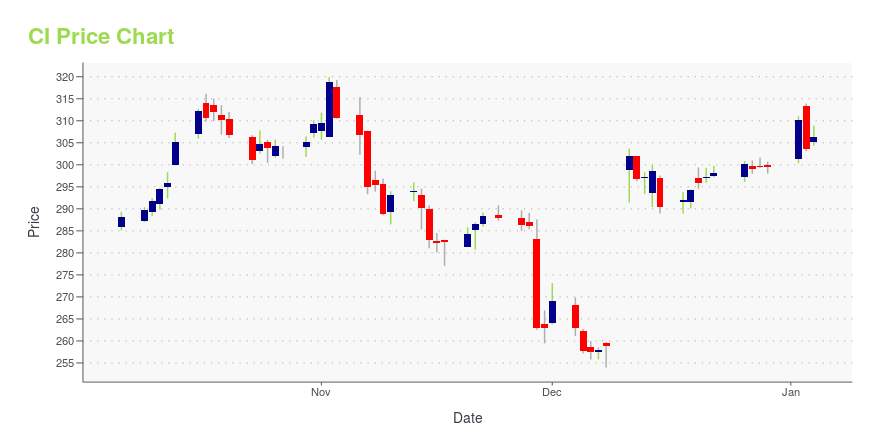
CI Stock Price Chart Interactive Chart >
Cigna Corp. (CI) Company Bio
Cigna is an American multinational managed healthcare and insurance company based in Bloomfield, Connecticut. Its insurance subsidiaries are major providers of medical, dental, disability, life and accident insurance and related products and services, the majority of which are offered through employers and other groups (e.g. governmental and non-governmental organizations, unions and associations). Cigna is incorporated in Connecticut. (Source:Wikipedia)
Latest CI News From Around the Web
Below are the latest news stories about CIGNA GROUP that investors may wish to consider to help them evaluate CI as an investment opportunity.
Why You Should Retain Cigna (CI) Stock in Your PortfolioCigna's (CI) strong Evernorth and Cigna Healthcare segments, growing medical membership and a positive 2023 outlook poise it well for growth. |
Finance Executives Hope Certainty Is Ahead on ESG DisclosuresNew environmental, social and corporate-governance disclosure rules can be “mind-blowing,” leaving finance executives to determine reporting requirements even as the list of unknowns grows. |
16 Most Promising Dividend Stocks According to AnalystsIn this article, we discuss 16 most promising dividend stocks according to analysts. You can skip our detailed analysis of dividend stocks and their performance over the years, and go directly to read 5 Most Promising Dividend Stocks According to Analysts. This year brought a notable shift in the investment scene, where technology stocks surged […] |
30 Healthiest Cities in the USIn this article, we will take a look at the 30 healthiest cities in the US. If you want to skip our detailed analysis of the global healthcare services market, you can go directly to 5 Healthiest Cities in the US. A healthy lifestyle does not only help us feel good, it also fuels our […] |
24 Biggest Industries in the World in 2024In this article, we’ll take a look at the 24 Biggest Industries in the World in 2024. The article also sheds light on what’s happening in the global economy and recent worldwide industrial developments. To skip the detailed analysis and have a quick overview of the top 10, read 10 Biggest Industries in the World […] |
CI Price Returns
| 1-mo | 1.80% |
| 3-mo | -2.66% |
| 6-mo | 16.34% |
| 1-year | 19.45% |
| 3-year | 58.22% |
| 5-year | 118.29% |
| YTD | 15.71% |
| 2023 | -7.97% |
| 2022 | 46.68% |
| 2021 | 12.29% |
| 2020 | 1.83% |
| 2019 | 7.70% |
CI Dividends
| Ex-Dividend Date | Type | Payout Amount | Change | ||||||
|---|---|---|---|---|---|---|---|---|---|
| Loading, please wait... | |||||||||
Continue Researching CI
Want to see what other sources are saying about Cigna Corp's financials and stock price? Try the links below:Cigna Corp (CI) Stock Price | Nasdaq
Cigna Corp (CI) Stock Quote, History and News - Yahoo Finance
Cigna Corp (CI) Stock Price and Basic Information | MarketWatch
Loading social stream, please wait...