
Core Laboratories N.V. (CLB): Price and Financial Metrics
CLB Price/Volume Stats
| Current price | $24.17 | 52-week high | $27.94 |
| Prev. close | $24.35 | 52-week low | $13.82 |
| Day low | $23.63 | Volume | 519,800 |
| Day high | $24.51 | Avg. volume | 455,913 |
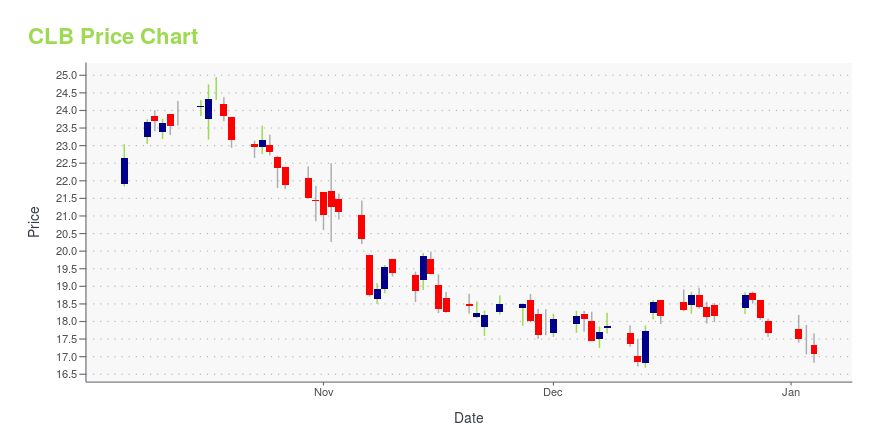
| 50-day MA | $19.83 | Dividend yield | 0.18% |
| 200-day MA | $18.13 | Market Cap | 1.13B |
CLB Stock Price Chart Interactive Chart >
Core Laboratories N.V. (CLB) Company Bio
Core Laboratories provides proprietary and patented reservoir description, production enhancement, and reservoir management services used to optimize petroleum reservoir performance. The company was founded in 1936 and is based in Amsterdam, the Netherlands.
Latest CLB News From Around the Web
Below are the latest news stories about CORE LABORATORIES INC that investors may wish to consider to help them evaluate CLB as an investment opportunity.
Declining Stock and Decent Financials: Is The Market Wrong About Core Laboratories Inc. (NYSE:CLB)?Core Laboratories (NYSE:CLB) has had a rough three months with its share price down 23%. But if you pay close... |
Phillips 66 (PSX) Announces $2.2B Capital Expenditure for 2024The budget aligns with Phillips 66's (PSX) strategic goal of returning $13-$15 billion to shareholders by the end of 2024. |
Petrobras (PBR) Signs Rig Extension Deals With ConstellationPetrobras (PBR) signs rig extension contracts with Constellation Oil Services, securing continued operations for two important rigs in its offshore drilling fleet. |
Shell (SHEL) Plans Two-Well Drilling Campaign in the North SeaShell's (SHEL) 2024 North Sea drilling targets Selene and Pensacola, showcasing its commitment to European energy security and innovation. |
Are Investors Undervaluing Core Laboratories Inc. (NYSE:CLB) By 34%?Key Insights Core Laboratories' estimated fair value is US$26.62 based on 2 Stage Free Cash Flow to Equity Current... |
CLB Price Returns
| 1-mo | 24.59% |
| 3-mo | 42.77% |
| 6-mo | 43.89% |
| 1-year | -1.57% |
| 3-year | -28.36% |
| 5-year | -53.17% |
| YTD | 37.04% |
| 2023 | -12.72% |
| 2022 | -8.97% |
| 2021 | -15.73% |
| 2020 | -29.05% |
| 2019 | -34.35% |
CLB Dividends
| Ex-Dividend Date | Type | Payout Amount | Change | ||||||
|---|---|---|---|---|---|---|---|---|---|
| Loading, please wait... | |||||||||
Continue Researching CLB
Want to see what other sources are saying about Core Laboratories N V's financials and stock price? Try the links below:Core Laboratories N V (CLB) Stock Price | Nasdaq
Core Laboratories N V (CLB) Stock Quote, History and News - Yahoo Finance
Core Laboratories N V (CLB) Stock Price and Basic Information | MarketWatch
Loading social stream, please wait...