
Celldex Therapeutics Inc. (CLDX): Price and Financial Metrics
CLDX Price/Volume Stats
| Current price | $44.56 | 52-week high | $53.18 |
| Prev. close | $43.86 | 52-week low | $22.11 |
| Day low | $43.11 | Volume | 1,052,000 |
| Day high | $46.86 | Avg. volume | 783,855 |
| 50-day MA | $36.87 | Dividend yield | N/A |
| 200-day MA | $36.51 | Market Cap | 2.94B |
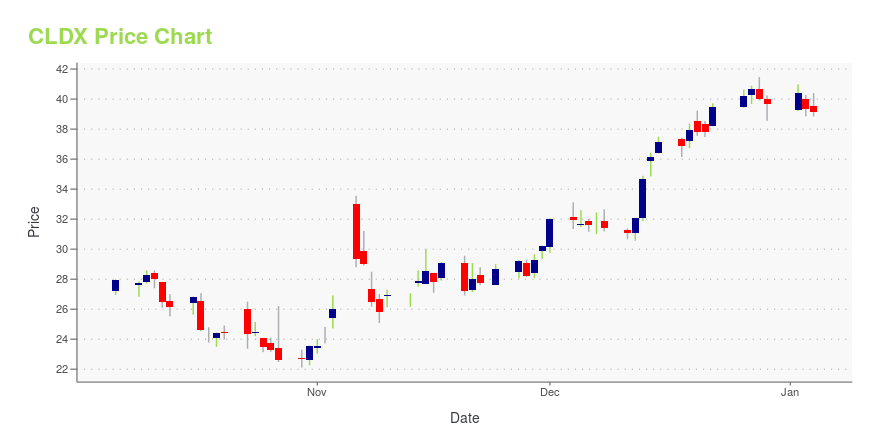
CLDX Stock Price Chart Interactive Chart >
Celldex Therapeutics Inc. (CLDX) Company Bio
Celldex Therapeutics Inc is a biopharmaceutical company. Celldex was formed in 2005 from a spin-off of the New Jersey based biopharmaceutical company Medarex. The company is engaged in the development and commercialization of immunotherapy technologies for the treatment of cancer and other difficult-to-treat diseases. Celldex is dedicated to developing monoclonal and bispecific antibodies that address devastating diseases for which available treatments are inadequate. The company’s drug pipeline includes antibody-based therapeutics which can engage the human immune system and/or directly affect critical pathways to improve the lives of patients with inflammatory diseases and many forms of cancer. The company is headquartered in Hampton, New Jersey and has other operational facilities in Massachusetts and Connecticut. Anthony S. Marucci, one of Celldex’s founders, serves as Chief Executive Officer, President, and Director.
Latest CLDX News From Around the Web
Below are the latest news stories about CELLDEX THERAPEUTICS INC that investors may wish to consider to help them evaluate CLDX as an investment opportunity.
Mirati (MRTX) Up 1.1% Since Last Earnings Report: Can It Continue?Mirati (MRTX) reported earnings 30 days ago. What's next for the stock? We take a look at earnings estimates for some clues. |
Celldex Therapeutics to Present at 6th Annual Evercore ISI HealthCONx ConferenceHAMPTON, N.J., Nov. 27, 2023 (GLOBE NEWSWIRE) -- Celldex Therapeutics, Inc. (NASDAQ:CLDX) announced today that management will participate in a fireside chat at the 6th Annual Evercore ISI HealthCONx Conference on Tuesday, November 28th at 5:05 pm ET. A webcast of the presentation will be available on the "Events & Presentations" page of the "Investors & Media" section of the Celldex website. A replay will be available for 90 days following the event. About Celldex Therapeutics, Inc.Celldex is a |
Biotech Breakthroughs: 3 Revolutionary Stocks Redefining HealthcareThe article embarks on a transformative journey through the biopharmaceutical frontier, where the listed companies stand as titans reshaping healthcare norms. |
Celldex Therapeutics Announces Pricing of Public Offering of Common StockHAMPTON, N.J., Nov. 07, 2023 (GLOBE NEWSWIRE) -- Celldex Therapeutics, Inc. (“Celldex” or the “Company”) (Nasdaq: CLDX) today announced the pricing of an underwritten public offering of 7,425,000 shares of its common stock at a public offering price of $27.00 per share. In connection with the offering, Celldex has granted the underwriters a 30-day option to purchase up to an additional 1,113,750 shares of common stock at the public offering price, less underwriting discounts and commissions. Jef |
Celldex Therapeutics Announces Proposed Public Offering of Common StockHAMPTON, N.J., Nov. 07, 2023 (GLOBE NEWSWIRE) -- Celldex Therapeutics, Inc. (“Celldex” or the “Company”) (Nasdaq: CLDX) today announced that it is proposing to offer and sell, subject to market conditions, shares of its common stock in an underwritten public offering. Celldex expects to grant the underwriters a 30-day option to purchase up to an additional 15% of the shares of common stock offered in the public offering. All of the shares of common stock are being offered by the Company. Celldex |
CLDX Price Returns
| 1-mo | 23.40% |
| 3-mo | 22.75% |
| 6-mo | 21.85% |
| 1-year | 29.99% |
| 3-year | 7.04% |
| 5-year | 1,889.29% |
| YTD | 12.36% |
| 2023 | -11.02% |
| 2022 | 15.35% |
| 2021 | 120.55% |
| 2020 | 685.65% |
| 2019 | -25.67% |
Continue Researching CLDX
Here are a few links from around the web to help you further your research on Celldex Therapeutics Inc's stock as an investment opportunity:Celldex Therapeutics Inc (CLDX) Stock Price | Nasdaq
Celldex Therapeutics Inc (CLDX) Stock Quote, History and News - Yahoo Finance
Celldex Therapeutics Inc (CLDX) Stock Price and Basic Information | MarketWatch
Loading social stream, please wait...