Calumet Specialty Products Partners, L.P. - Common units representing limited partner interests (CLMT): Price and Financial Metrics
CLMT Price/Volume Stats
Current price | $19.00 | 52-week high | $20.50 |
Prev. close | $18.98 | 52-week low | $12.50 |
Day low | $18.81 | Volume | 66,947 |
Day high | $19.04 | Avg. volume | 88,965 |
50-day MA | $17.53 | Dividend yield | N/A |
200-day MA | $16.96 | Market Cap | 1.52B |
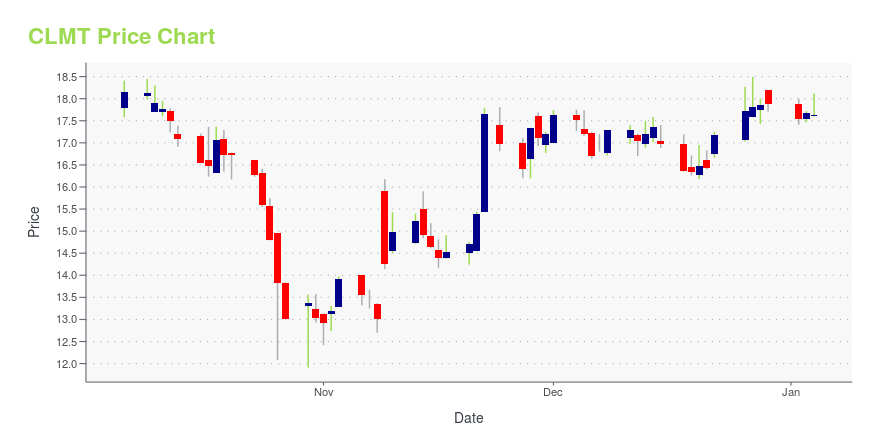
CLMT Stock Price Chart Interactive Chart >
CLMT POWR Grades
- Momentum is the dimension where CLMT ranks best; there it ranks ahead of 87.77% of US stocks.
- CLMT's strongest trending metric is Stability; it's been moving up over the last 177 days.
- CLMT ranks lowest in Quality; there it ranks in the 13th percentile.
CLMT Stock Summary
- The capital turnover (annual revenue relative to shareholder's equity) for CLMT is -7.7 -- better than only 2.13% of US stocks.
- Equity multiplier, or assets relative to shareholders' equity, comes in at -5.24 for CALUMET SPECIALTY PRODUCTS PARTNERS LP; that's greater than it is for only 3.32% of US stocks.
- Over the past twelve months, CLMT has reported earnings growth of 421.86%, putting it ahead of 96.44% of US stocks in our set.
- If you're looking for stocks that are quantitatively similar to CALUMET SPECIALTY PRODUCTS PARTNERS LP, a group of peers worth examining would be AZZ, VGR, RYAM, AGRO, and SABR.
- CLMT's SEC filings can be seen here. And to visit CALUMET SPECIALTY PRODUCTS PARTNERS LP's official web site, go to www.calumetspecialty.com.
CLMT Valuation Summary
- In comparison to the median Energy stock, CLMT's price/sales ratio is 77.78% lower, now standing at 0.4.
- CLMT's price/sales ratio has moved down 0 over the prior 215 months.
Below are key valuation metrics over time for CLMT.
Stock | Date | P/S | P/B | P/E | EV/EBIT |
---|---|---|---|---|---|
CLMT | 2023-09-14 | 0.4 | -2.9 | -36.2 | 24.7 |
CLMT | 2023-09-13 | 0.4 | -2.8 | -35.3 | 24.4 |
CLMT | 2023-09-12 | 0.4 | -2.8 | -35.4 | 24.4 |
CLMT | 2023-09-11 | 0.4 | -2.9 | -36.0 | 24.6 |
CLMT | 2023-09-08 | 0.4 | -2.9 | -36.3 | 24.7 |
CLMT | 2023-09-07 | 0.4 | -2.8 | -34.9 | 24.3 |
CLMT Growth Metrics
- The 5 year net income to common stockholders growth rate now stands at 72.15%.
- The 4 year net income to common stockholders growth rate now stands at 72.15%.
- Its 2 year revenue growth rate is now at 10.68%.

The table below shows CLMT's growth in key financial areas (numbers in millions of US dollars).
Date | Revenue | Operating Cash Flow | Net Income to Common Stock |
---|---|---|---|
2022-09-30 | 4,552.7 | 136.6 | -178.8 |
2022-06-30 | 4,262.6 | 132.1 | -143.5 |
2022-03-31 | 3,645.6 | 3.4 | -205.3 |
2021-12-31 | 3,148 | -44 | -254.9 |
2021-09-30 | 2,836.1 | -32.7 | -249.9 |
2021-06-30 | 2,529.2 | -76.9 | -355.4 |
CLMT's Quality Factors
The “Quality” component of the POWR Ratings focuses on 31 different factors of a companies fundamentals and operational strength. Here are some key insights as we drill into the specifics of these quality attributes.- CLMT has a Quality Grade of C, ranking ahead of 45.28% of graded US stocks.
- CLMT's asset turnover comes in at 1.381 -- ranking 9th of 137 Petroleum and Natural Gas stocks.
- PXD, RNGR, and IO are the stocks whose asset turnover ratios are most correlated with CLMT.
The table below shows CLMT's key quality metrics over time.
Period | Asset Turnover | Gross Margin | ROIC |
---|---|---|---|
2021-06-30 | 1.381 | 0.017 | -0.092 |
2021-03-31 | 1.191 | 0.052 | -0.061 |
2020-12-31 | 1.243 | 0.093 | -0.009 |
2020-09-30 | 1.355 | 0.112 | 0.009 |
2020-06-30 | 1.480 | 0.124 | 0.030 |
2020-03-31 | 1.629 | 0.112 | 0.022 |
Calumet Specialty Products Partners, L.P. - Common units representing limited partner interests (CLMT) Company Bio
Calumet Specialty Products Partners LP produces and sells specialty hydrocarbon products in North America. It operates in three segments: Specialty Products, Fuel Products, and Oilfield Services. The company was founded in 1916 and is based in Indianapolis, Indiana.
Latest CLMT News From Around the Web
Below are the latest news stories about CALUMET SPECIALTY PRODUCTS PARTNERS LP that investors may wish to consider to help them evaluate CLMT as an investment opportunity.
Montana Renewables Receives First Camelina OilCalumet Specialty Products Partners, L.P. (NASDAQ: CLMT) today announced that Montana Renewables LLC ("MRL") is hosting an event with the Montana community to celebrate the first receipts of Camelina Oil into its Great Falls renewable fuels facility today. Representatives of the State, County and City governments along with suppliers and supporters of rural agricultural development will attend today's ceremony in Great Falls, Montana at 10 am local time. |
Calumet CFO Vince Donargo to retire in April 2024, David Lunin joins as CFO DesignateCalumet Specialty Products Partners, L.P. (NASDAQ: CLMT) (the "Partnership," "Calumet," "Company," "we," "our" or "us"), today announced that Vince Donargo has elected to step down as CFO on December 31, 2023, and he will continue in an advisory role until his retirement at the end of April, 2024. |
Calumet Specialty Products Partners LP (CLMT): An In-Depth Look at Its Significant OvervaluationExploring the intrinsic value and financial health of Calumet Specialty Products Partners LP |
Calumet says leak at Montana hydrogen plant to impact throughputCalumet Specialty Products Partners said on Thursday a leak detected in the steam recovery system at its Montana renewable hydrogen plant would limit throughput until repaired. The company, which manufactures and produces specialty products and renewable fuels, said the leak was detected earlier this month and the repair is expected to be completed in late September. Calumet's shares fell 1.2% to $17.48 in morning trade. |
Calumet Provides Operational Update for Montana Renewables LLCCalumet Specialty Products Partners, L.P. (NASDAQ: CLMT) ("Calumet," "we," "our" or "us") today provided an operational update on its Montana Renewables LLC business. |
CLMT Price Returns
1-mo | 6.62% |
3-mo | 19.80% |
6-mo | 9.32% |
1-year | 38.18% |
3-year | 611.61% |
5-year | 196.88% |
YTD | 12.56% |
2022 | 27.88% |
2021 | 321.73% |
2020 | -14.25% |
2019 | 65.16% |
2018 | -71.30% |
Continue Researching CLMT
Want to see what other sources are saying about Calumet Specialty Products Partners LP's financials and stock price? Try the links below:Calumet Specialty Products Partners LP (CLMT) Stock Price | Nasdaq
Calumet Specialty Products Partners LP (CLMT) Stock Quote, History and News - Yahoo Finance
Calumet Specialty Products Partners LP (CLMT) Stock Price and Basic Information | MarketWatch
Loading social stream, please wait...