Clean Energy Fuels Corp. (CLNE): Price and Financial Metrics
CLNE Price/Volume Stats
Current price | $3.99 | 52-week high | $7.73 |
Prev. close | $3.97 | 52-week low | $3.84 |
Day low | $3.93 | Volume | 1,537,500 |
Day high | $4.01 | Avg. volume | 1,919,394 |
50-day MA | $4.45 | Dividend yield | N/A |
200-day MA | $4.77 | Market Cap | 889.64M |
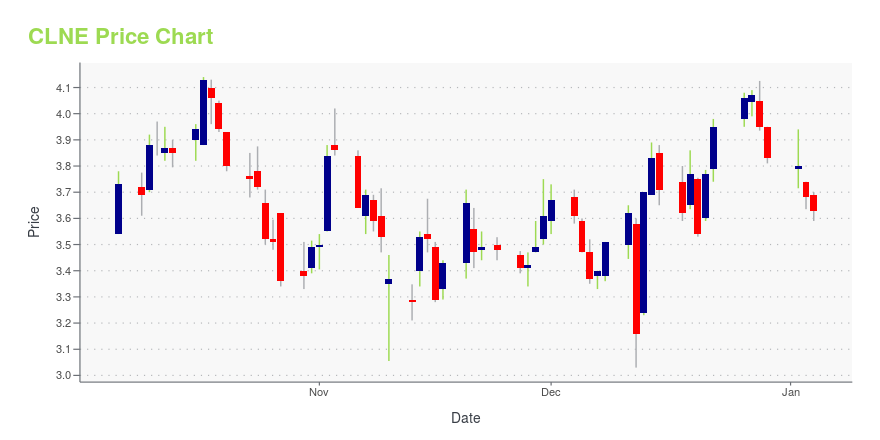
CLNE Stock Price Chart Interactive Chart >
CLNE POWR Grades
- CLNE scores best on the Momentum dimension, with a Momentum rank ahead of 81.99% of US stocks.
- The strongest trend for CLNE is in Growth, which has been heading up over the past 179 days.
- CLNE ranks lowest in Value; there it ranks in the 0th percentile.
CLNE Stock Summary
- Price to trailing twelve month operating cash flow for CLNE is currently 33.12, higher than 88.12% of US stocks with positive operating cash flow.
- With a year-over-year growth in debt of 171.58%, CLEAN ENERGY FUELS CORP's debt growth rate surpasses 93.49% of about US stocks.
- Over the past twelve months, CLNE has reported earnings growth of 72.06%, putting it ahead of 84.93% of US stocks in our set.
- Stocks with similar financial metrics, market capitalization, and price volatility to CLEAN ENERGY FUELS CORP are DHIL, CRGE, CHCI, CLEU, and ZETA.
- Visit CLNE's SEC page to see the company's official filings. To visit the company's web site, go to www.cleanenergyfuels.com.
CLNE Valuation Summary
- CLNE's price/earnings ratio is -13.4; this is 261.45% lower than that of the median Energy stock.
- Over the past 199 months, CLNE's price/sales ratio has gone down 3.6.
Below are key valuation metrics over time for CLNE.
Stock | Date | P/S | P/B | P/E | EV/EBIT |
---|---|---|---|---|---|
CLNE | 2023-09-14 | 2.2 | 1.5 | -13.4 | -18.1 |
CLNE | 2023-09-13 | 2.2 | 1.4 | -13.1 | -17.7 |
CLNE | 2023-09-12 | 2.2 | 1.5 | -13.5 | -18.3 |
CLNE | 2023-09-11 | 2.2 | 1.5 | -13.4 | -18.2 |
CLNE | 2023-09-08 | 2.1 | 1.4 | -12.9 | -17.5 |
CLNE | 2023-09-07 | 2.1 | 1.4 | -12.8 | -17.4 |
CLNE Growth Metrics
- The 4 year net cashflow from operations growth rate now stands at -21.48%.
- The 5 year net income to common stockholders growth rate now stands at -28.23%.
- Its year over year revenue growth rate is now at -7.38%.

The table below shows CLNE's growth in key financial areas (numbers in millions of US dollars).
Date | Revenue | Operating Cash Flow | Net Income to Common Stock |
---|---|---|---|
2022-09-30 | 398.336 | 40.183 | -48.775 |
2022-06-30 | 358.744 | 60.619 | -43.736 |
2022-03-31 | 262 | 42.88 | -110.168 |
2021-12-31 | 255.646 | 41.298 | -93.146 |
2021-09-30 | 238.676 | 40.762 | -93.331 |
2021-06-30 | 223.467 | 24.199 | -91.668 |
CLNE's Quality Factors
The “Quality” component of the POWR Ratings focuses on 31 different factors of a companies fundamentals and operational strength. Here are some key insights as we drill into the specifics of these quality attributes.- CLNE has a Quality Grade of C, ranking ahead of 41.47% of graded US stocks.
- CLNE's asset turnover comes in at 0.296 -- ranking 26th of 105 Utilities stocks.
- KMI, TRGP, and WTRG are the stocks whose asset turnover ratios are most correlated with CLNE.
The table below shows CLNE's key quality metrics over time.
Period | Asset Turnover | Gross Margin | ROIC |
---|---|---|---|
2021-06-30 | 0.296 | 0.144 | -0.145 |
2021-03-31 | 0.408 | 0.353 | -0.022 |
2020-12-31 | 0.415 | 0.364 | -0.004 |
2020-09-30 | 0.468 | 0.428 | 0.075 |
2020-06-30 | 0.469 | 0.420 | 0.070 |
2020-03-31 | 0.482 | 0.415 | 0.071 |
CLNE Price Target
For more insight on analysts targets of CLNE, see our CLNE price target page. And for a list of of all stocks sorted by upside potential based on analyst target price, see our Top Price Target page.
Average Price Target | $15.14 | Average Broker Recommendation | 1.81 (Hold) |
Clean Energy Fuels Corp. (CLNE) Company Bio
Clean Energy Fuels Corp. provides natural gas as an alternative fuel for vehicle fleets in the United States and Canada. It designs, builds, operates, and maintains fueling stations; and supplies compressed natural gas (CNG) fuel for light, medium, and heavy-duty vehicles, as well as liquefied natural gas (LNG) fuel for medium and heavy-duty vehicles. The company was founded in 2001 and is based in Newport Beach, California.
Latest CLNE News From Around the Web
Below are the latest news stories about CLEAN ENERGY FUELS CORP that investors may wish to consider to help them evaluate CLNE as an investment opportunity.
Clean Energy Appoints Mathieu Soulas to Board of DirectorsNEWPORT BEACH, Calif., September 21, 2023--Clean Energy Appoints Mathieu Soulas to Board of Directors . |
7 Small-Cap Stocks Analysts Predict Will Double in 2024While small-cap stocks to buy present exceptional risk, they also offer tremendous rewards for intrepid retail investors. |
Unraveling the Future of Clean Energy Fuels Corp (CLNE): A Deep Dive into Key MetricsUnderstanding the Factors Limiting Growth and Performance |
Is Clean Energy Fuels (CLNE) Too Good to Be True? A Comprehensive Analysis of a Potential Value TrapNavigating the Thin Line Between Value and Trap |
Those who invested in Clean Energy Technologies (NASDAQ:CETY) five years ago are up 138%The last three months have been tough on Clean Energy Technologies, Inc. ( NASDAQ:CETY ) shareholders, who have seen... |
CLNE Price Returns
1-mo | -3.39% |
3-mo | -12.31% |
6-mo | -5.23% |
1-year | -25.14% |
3-year | 65.56% |
5-year | 52.87% |
YTD | -23.27% |
2022 | -15.17% |
2021 | -22.01% |
2020 | 235.90% |
2019 | 36.05% |
2018 | -15.27% |
Continue Researching CLNE
Here are a few links from around the web to help you further your research on Clean Energy Fuels Corp's stock as an investment opportunity:Clean Energy Fuels Corp (CLNE) Stock Price | Nasdaq
Clean Energy Fuels Corp (CLNE) Stock Quote, History and News - Yahoo Finance
Clean Energy Fuels Corp (CLNE) Stock Price and Basic Information | MarketWatch
Loading social stream, please wait...