Celestica, Inc. (CLS): Price and Financial Metrics


Celestica, Inc. (CLS): $12.58

0.23 (+1.86%)

POWR Rating

Component Grades

Growth

S

Value

I

Momentum

G

Stability

N

Sentiment

U

Quality

P

CLS POWR Grades

  • CLS scores best on the Growth dimension, with a Growth rank ahead of 99.5% of US stocks.
  • The strongest trend for CLS is in Momentum, which has been heading up over the past 177 days.
  • CLS's current lowest rank is in the Stability metric (where it is better than 65.38% of US stocks).

CLS Stock Summary

  • The capital turnover (annual revenue relative to shareholder's equity) for CLS is 4.32 -- better than 89.04% of US stocks.
  • With a price/sales ratio of 0.21, CELESTICA INC has a higher such ratio than just 6.59% of stocks in our set.
  • Over the past twelve months, CLS has reported earnings growth of 57.01%, putting it ahead of 79.36% of US stocks in our set.
  • If you're looking for stocks that are quantitatively similar to CELESTICA INC, a group of peers worth examining would be HLLY, FTHM, TNET, BMBL, and ICHR.
  • CLS's SEC filings can be seen here. And to visit CELESTICA INC's official web site, go to www.celestica.com.

CLS Valuation Summary

  • CLS's price/earnings ratio is 10.4; this is 56.12% lower than that of the median Technology stock.
  • Over the past 243 months, CLS's price/earnings ratio has gone up 16.6.

Below are key valuation metrics over time for CLS.

Stock Date P/S P/B P/E EV/EBIT
CLS 2023-03-21 0.2 0.9 10.4 7.3
CLS 2023-03-20 0.2 0.9 10.2 7.2
CLS 2023-03-17 0.2 0.9 10.0 7.1
CLS 2023-03-16 0.2 0.9 9.9 7.1
CLS 2023-03-15 0.2 0.9 9.9 7.0
CLS 2023-03-14 0.2 0.9 10.3 7.3

CLS Growth Metrics

    Its 5 year net cashflow from operations growth rate is now at 57.13%.
  • The 2 year revenue growth rate now stands at 3.34%.
  • Its 3 year net income to common stockholders growth rate is now at -34.21%.
Over the past 49 months, CLS's revenue has gone up $259,400,000.

The table below shows CLS's growth in key financial areas (numbers in millions of US dollars).

Date Revenue Operating Cash Flow Net Income to Common Stock
2022-09-30 6,719.5 262.4 135
2022-06-30 6,263.6 243.7 124.5
2022-03-31 5,966.7 213.3 115.2
2021-12-31 5,634.7 226.8 103.9
2021-12-31 5,634.7 226.8 103.9
2021-09-30 5,509.2 210.7 92.1

CLS's Quality Factors

The “Quality” component of the POWR Ratings focuses on 31 different factors of a companies fundamentals and operational strength. Here are some key insights as we drill into the specifics of these quality attributes.
  • CLS has a Quality Grade of C, ranking ahead of 63.33% of graded US stocks.
  • CLS's asset turnover comes in at 1.591 -- ranking 13th of 208 Electronic Equipment stocks.
  • 500 - Internal server error

The table below shows CLS's key quality metrics over time.

Period Asset Turnover Gross Margin ROIC
2020-12-31 1.591 0.076 0.070
2019-12-31 1.614 0.065 0.078
2018-12-31 1.985 0.065 0.065
2017-12-31 2.119 0.068 0.112
2016-12-31 2.214 0.071 0.144
2015-12-31 2.171 0.069 0.111

CLS Price Target

For more insight on analysts targets of CLS, see our CLS price target page. And for a list of of all stocks sorted by upside potential based on analyst target price, see our Top Price Target page.

Average Price Target $9.75 Average Broker Recommendation 2 (Hold)

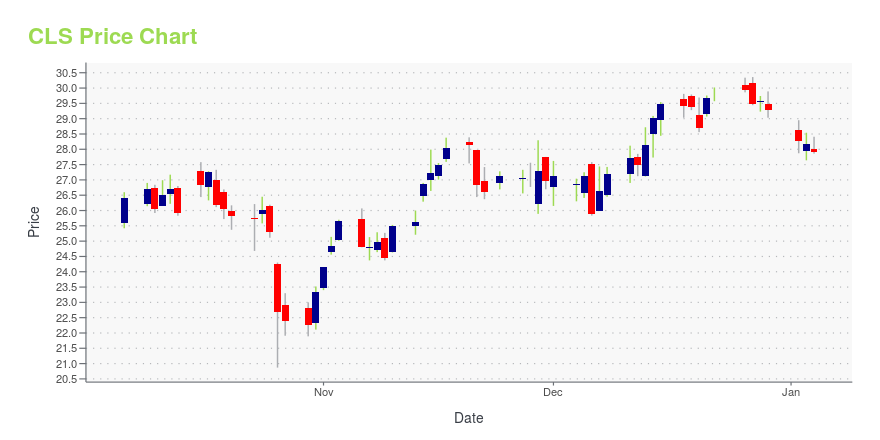
CLS Stock Price Chart Interactive Chart >

Price chart for CLS

CLS Price/Volume Stats

Current price $12.58 52-week high $14.28
Prev. close $12.35 52-week low $8.21
Day low $12.42 Volume 793,800
Day high $12.65 Avg. volume 465,398
50-day MA $12.95 Dividend yield N/A
200-day MA $11.04 Market Cap 1.53B

Celestica, Inc. (CLS) Company Bio


Celestica provides supply chain solutions to customers in the communications, consumer, industrial, aerospace and defense, healthcare, solar, green technology, semiconductor equipment, servers, and storage end markets in the Americas, Asia, and Europe. The company was founded in 1996 and is based in Toronto, Canada.


CLS Latest News Stream


Event/Time News Detail
Loading, please wait...

CLS Latest Social Stream


Loading social stream, please wait...

View Full CLS Social Stream

Latest CLS News From Around the Web

Below are the latest news stories about CELESTICA INC that investors may wish to consider to help them evaluate CLS as an investment opportunity.

Celestica (CLS) Stock Sinks As Market Gains: What You Should Know

In the latest trading session, Celestica (CLS) closed at $12.37, marking a -0.56% move from the previous day.

Yahoo | March 24, 2023

Celestica (CLS) Gains As Market Dips: What You Should Know

Celestica (CLS) closed the most recent trading day at $12, moving +0.84% from the previous trading session.

Yahoo | March 17, 2023

Onex Intends to Convert its Celestica MVS to SVS

TORONTO, March 14, 2023 (GLOBE NEWSWIRE) -- Celestica Inc. (NYSE: CLS) (TSX: CLS), a leader in design, manufacturing and supply chain solutions for the world's most innovative companies, is announcing Onex’ stated intention to convert its multiple voting shares (MVS) in Celestica then held to subordinate voting shares (SVS), on a one-for-one basis, in approximately six months. “Celestica and Onex have shared a productive relationship for over 25 years. The planned conversion of Onex’ MVS and the

Yahoo | March 14, 2023

Celestica Files Form 20-F

TORONTO, March 13, 2023 (GLOBE NEWSWIRE) -- Celestica Inc. (NYSE, TSX: CLS), a leader in design, manufacturing and supply chain solutions for the world's most innovative companies, today announced that its annual report on Form 20-F for the year ended December 31, 2022 has been filed with the United States Securities and Exchange Commission. The annual report on Form 20-F can be accessed on the company's website at www.celestica.com in the Investor Relations section. The Form 20-F can also be vi

Yahoo | March 13, 2023

Celestica (CLS) Outpaces Stock Market Gains: What You Should Know

In the latest trading session, Celestica (CLS) closed at $13.15, marking a +1.15% move from the previous day.

Yahoo | March 8, 2023

Read More 'CLS' Stories Here

CLS Price Returns

1-mo -2.86%
3-mo 11.62%
6-mo 49.58%
1-year 5.54%
3-year 257.39%
5-year 21.55%
YTD 11.62%
2022 1.26%
2021 37.92%
2020 -2.42%
2019 -5.70%
2018 -16.32%

Continue Researching CLS

Here are a few links from around the web to help you further your research on Celestica Inc's stock as an investment opportunity:

Celestica Inc (CLS) Stock Price | Nasdaq
Celestica Inc (CLS) Stock Quote, History and News - Yahoo Finance
Celestica Inc (CLS) Stock Price and Basic Information | MarketWatch

Get Free Updates

Join thousands of investors who get the latest news, insights and top rated picks from StockNews.com!


Page generated in 0.732 seconds.