
Comerica Incorporated (CMA): Price and Financial Metrics
CMA Price/Volume Stats
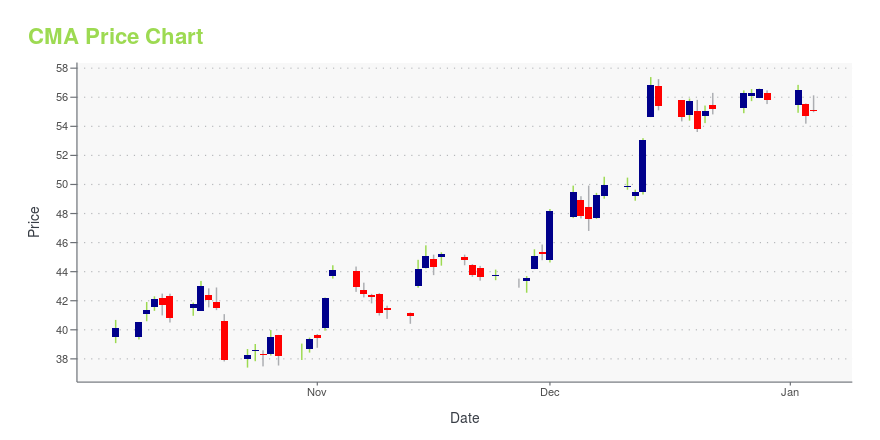
| Current price | $53.40 | 52-week high | $58.50 |
| Prev. close | $52.82 | 52-week low | $37.40 |
| Day low | $52.66 | Volume | 1,100,071 |
| Day high | $53.47 | Avg. volume | 2,264,123 |
| 50-day MA | $50.92 | Dividend yield | 5.45% |
| 200-day MA | $50.08 | Market Cap | 7.08B |
CMA Stock Price Chart Interactive Chart >
Comerica Incorporated (CMA) Company Bio
Comerica Incorporated is a financial services company headquartered in Dallas, Texas. It has retail banking operations in Texas, Arizona, California, Colorado, and Florida, with select business operations in several other U.S. states, as well as in Mexico. (Source:Wikipedia)
Latest CMA News From Around the Web
Below are the latest news stories about COMERICA INC that investors may wish to consider to help them evaluate CMA as an investment opportunity.
Is Comerica a Stock You Can Bank On?Financial services company Comerica was upgraded Wednesday by TheStreet's Quant Ratings service. The On-Balance-Volume (OBV) line has been mostly flat but with a very slight upward drift since October. The Moving Average Convergence Divergence (MACD) oscillator is above the zero line but has narrowed and could cross to the downside for a take profit sell signal. |
3 Sleeper Stocks You’ll Regret Not Buying Soon: December EditionInvestors should look at these three undervalued sleeper stocks in December to boost and fortify their financial portfolios. |
Buy Comerica, skip Bank of America: Good Buy or GoodbyeIn this edition of Good Buy or Goodbye, Yahoo Finance Host Julie Hyman is joined by Unlimited Funds Co-Founder Bob Elliot to hear out his winners and losers in the banking sector. Elliot puts a "Good Buy" rating on Comerica (CMA), highlighting the mid-sized lender for an attractive valuation, lower-risk balance sheet, and growth opportunities in key states like Texas and California. While Comerica felt ripples from earlier regional bank failures, Elliot says it is "positioned to take advantage of the weakness in some of the other banks." Conversely, Elliot assigns a "Goodbye" call on industry titan Bank of America (BAC). He notes that despite also facing collateral damage from the regional banking crisis, BofA trades at a higher valuation while seeing margin compression and stagnating m... |
Comerica Incorporated (CMA) Soars 7.1%: Is Further Upside Left in the Stock?Comerica Incorporated (CMA) witnessed a jump in share price last session on above-average trading volume. The latest trend in earnings estimate revisions for the stock doesn't suggest further strength down the road. |
Comerica Bank Exceeds Three-Year, $5 Billion Small Business Lending CommitmentComerica Bank announced today that it has exceeded the three-year, $5 billion small business lending commitment first announced in May 2021. Through 2023 third quarter earnings, Comerica Bank has achieved 102% of its commitment since the bank's initial announcement. |
CMA Price Returns
| 1-mo | 11.72% |
| 3-mo | 4.09% |
| 6-mo | 0.06% |
| 1-year | 8.09% |
| 3-year | -8.75% |
| 5-year | -6.16% |
| YTD | -1.53% |
| 2023 | -11.09% |
| 2022 | -20.38% |
| 2021 | 61.53% |
| 2020 | -16.79% |
| 2019 | 8.46% |
CMA Dividends
| Ex-Dividend Date | Type | Payout Amount | Change | ||||||
|---|---|---|---|---|---|---|---|---|---|
| Loading, please wait... | |||||||||
Continue Researching CMA
Want to do more research on Comerica Inc's stock and its price? Try the links below:Comerica Inc (CMA) Stock Price | Nasdaq
Comerica Inc (CMA) Stock Quote, History and News - Yahoo Finance
Comerica Inc (CMA) Stock Price and Basic Information | MarketWatch
Loading social stream, please wait...