Cambium Networks Corp. (CMBM): Price and Financial Metrics
GET POWR RATINGS... FREE!
CMBM POWR Grades
- CMBM scores best on the Value dimension, with a Value rank ahead of 84.04% of US stocks.
- The strongest trend for CMBM is in Quality, which has been heading down over the past 179 days.
- CMBM's current lowest rank is in the Growth metric (where it is better than 5.51% of US stocks).
CMBM Stock Summary
- The capital turnover (annual revenue relative to shareholder's equity) for CMBM is 3 -- better than 83.58% of US stocks.
- Cambium Networks Corp's stock had its IPO on June 26, 2019, making it an older stock than merely 7.98% of US equities in our set.
- With a year-over-year growth in debt of -41.61%, Cambium Networks Corp's debt growth rate surpasses only 9.83% of about US stocks.
- Stocks with similar financial metrics, market capitalization, and price volatility to Cambium Networks Corp are MCHX, LQDT, ARAY, CYBE, and VNDA.
- CMBM's SEC filings can be seen here. And to visit Cambium Networks Corp's official web site, go to www.cambiumnetworks.com.
CMBM Valuation Summary
- In comparison to the median Technology stock, CMBM's price/sales ratio is 46.79% lower, now standing at 2.9.
- CMBM's EV/EBIT ratio has moved down 18.3 over the prior 27 months.
Below are key valuation metrics over time for CMBM.
Stock | Date | P/S | P/B | P/E | EV/EBIT |
---|---|---|---|---|---|
CMBM | 2021-09-01 | 2.9 | 9.9 | 20.9 | 21.4 |
CMBM | 2021-08-31 | 2.9 | 9.9 | 20.9 | 21.4 |
CMBM | 2021-08-30 | 2.9 | 9.7 | 20.6 | 21.1 |
CMBM | 2021-08-27 | 3.0 | 10.1 | 21.3 | 21.8 |
CMBM | 2021-08-26 | 2.9 | 9.7 | 20.4 | 20.9 |
CMBM | 2021-08-25 | 2.9 | 9.8 | 20.8 | 21.3 |
CMBM's Quality Factors
The “Quality” component of the POWR Ratings focuses on 31 different factors of a companies fundamentals and operational strength. Here are some key insights as we drill into the specifics of these quality attributes.- CMBM has a Quality Grade of B, ranking ahead of 88.62% of graded US stocks.
- CMBM's asset turnover comes in at 1.647 -- ranking 11th of 208 Electronic Equipment stocks.
- 500 - Internal server error
The table below shows CMBM's key quality metrics over time.
Period | Asset Turnover | Gross Margin | ROIC |
---|---|---|---|
2021-06-30 | 1.647 | 0.500 | 0.534 |
2021-03-31 | 1.592 | 0.499 | 0.410 |
2020-12-31 | 1.528 | 0.501 | 0.238 |
2020-09-30 | 1.494 | 0.502 | 0.123 |
2020-06-30 | 1.467 | 0.500 | 0.090 |
2020-03-31 | 1.412 | 0.502 | -0.024 |
CMBM Price Target
For more insight on analysts targets of CMBM, see our CMBM price target page. And for a list of of all stocks sorted by upside potential based on analyst target price, see our Top Price Target page.
Average Price Target | $68.29 | Average Broker Recommendation | 1.39 (Strong Buy) |
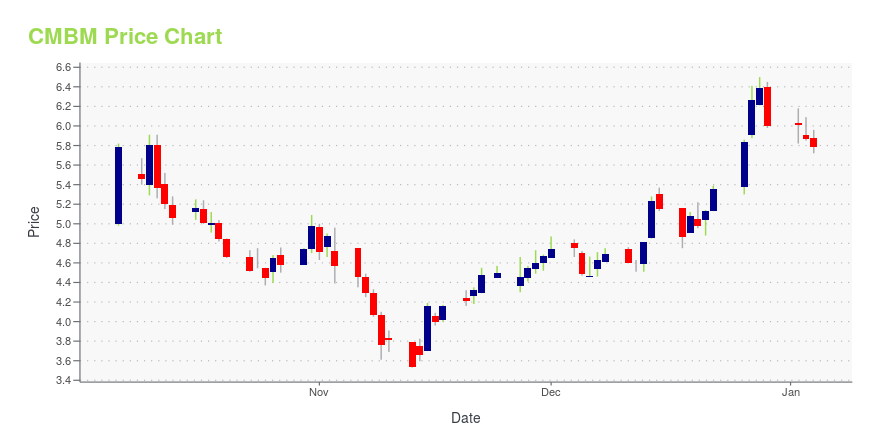
CMBM Stock Price Chart Interactive Chart >
CMBM Price/Volume Stats
Current price | $14.66 | 52-week high | $59.66 |
Prev. close | $13.77 | 52-week low | $12.40 |
Day low | $13.88 | Volume | 112,200 |
Day high | $14.75 | Avg. volume | 181,107 |
50-day MA | $17.88 | Dividend yield | N/A |
200-day MA | $26.17 | Market Cap | 393.25M |
Cambium Networks Corp. (CMBM) Company Bio
Cambium Networks Corp. engages in wireless broadband networking infrastructure services for network operators, including medium-sized wireless Internet service providers, enterprises and government agencies. It offers secure wireless broadband point-to-point and point-to-multipoint platforms. The company was founded in 2011 and is headquartered in Rolling Meadows, IL.
Latest CMBM News From Around the Web
Below are the latest news stories about Cambium Networks Corp that investors may wish to consider to help them evaluate CMBM as an investment opportunity.
Raymond James: 2 ‘Strong Buy’ Stocks That Could Climb Over 50%Ukraine tensions, but the combination of inflation and the Fed’s upcoming interest rate hike cycle are also making investors nervous. So, the markets have been on the backfoot for the most part, but the upshot from all of this is that we could be nearing a bottom. |
What 4 Analyst Ratings Have To Say About Cambium NetworksOver the past 3 months, 4 analysts have published their opinion on Cambium Networks (NASDAQ: CMBM ) stock. These analysts are typically employed by large Wall Street banks and tasked with understanding a company''s business to predict how a stock will trade over the upcoming year. Bullish Somewhat Bullish Indifferent Somewhat Bearish Bearish Total Ratings 2 0 2 0 0 Last 30D 0 0 1 0 0 1M Ago 2 0 0 0 0 2M Ago 0 0 0 0 0 3M Ago 0 0 1 0 0 According to 4 analyst offering 12-month price targets in the last 3 months, Cambium Networks has an average price target of $35.0 with a high of $43.00 and a low of $30.00. Full story available on Benzinga.com |
Expert Ratings For Cambium NetworksCambium Networks (NASDAQ: CMBM ) has observed the following analyst ratings within the last quarter: Bullish Somewhat Bullish Indifferent Somewhat Bearish Bearish Total Ratings 2 0 2 0 0 Last 30D 0 0 1 0 0 1M Ago 2 0 0 0 0 2M Ago 0 0 0 0 0 3M Ago 0 0 1 0 0 In the last 3 months, 4 analysts have offered 12-month price targets for Cambium Networks. The company has an average price target of $35.0 with a high of $43.00 and a low of $30.00. Below is a summary of how these 4 analysts rated Cambium Networks over the past 3 months. The greater the number Full story available on Benzinga.com |
What Cambium Networks Corporation's (NASDAQ:CMBM) 34% Share Price Gain Is Not Telling YouCambium Networks Corporation ( NASDAQ:CMBM ) shares have had a really impressive month, gaining 34% after a shaky... |
Cambium Networks Corporation (CMBM) CEO Atul Bhatnagar on Q4 2021 Results - Earnings Call TranscriptCambium Networks Corporation (CMBM) Q4 2021 Results Conference Call February 17, 2022 4:30 PM ET Company Participants Peter Schuman - Senior Director, IR Atul Bhatnagar - President, CEO & Director Stephen Cumming - CFO Conference Call Participants Scott Searle - ROTH Capital Samik Chatterjee - JPMorgan Rod Hall - Goldman... |
CMBM Price Returns
1-mo | -8.32% |
3-mo | -48.65% |
6-mo | -46.83% |
1-year | -74.60% |
3-year | N/A |
5-year | N/A |
YTD | -42.80% |
2021 | 2.19% |
2020 | 186.96% |
2019 | N/A |
2018 | N/A |
2017 | N/A |
Loading social stream, please wait...