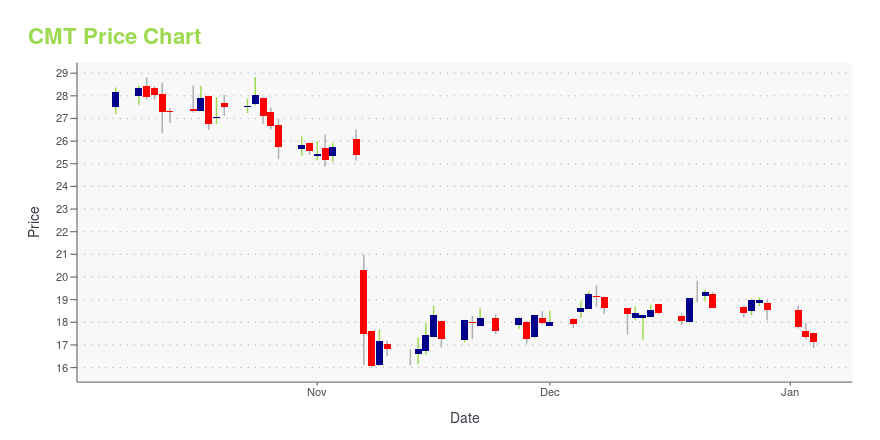
Core Molding Technologies Inc (CMT): Price and Financial Metrics
GET POWR RATINGS... FREE!
CMT Stock Summary
- With a one year PEG ratio of 276.24, Core Molding Technologies Inc is expected to have a higher PEG ratio (a measure of how expensive a stock is relative to its expected earnings growth) than 90.66% of US stocks.
- Core Molding Technologies Inc's stock had its IPO on September 16, 1988, making it an older stock than 89.16% of US equities in our set.
- With a price/sales ratio of 0.3, Core Molding Technologies Inc has a higher such ratio than merely 5.28% of stocks in our set.
- Stocks that are quantitatively similar to CMT, based on their financial statements, market capitalization, and price volatility, are ATRO, KMT, LRN, IHT, and APAM.
- CMT's SEC filings can be seen here. And to visit Core Molding Technologies Inc's official web site, go to www.coremt.com.
CMT Valuation Summary
- CMT's price/sales ratio is 0.4; this is 82.61% lower than that of the median Basic Materials stock.
- Over the past 243 months, CMT's price/sales ratio has gone up 0.2.
- CMT's price/earnings ratio has moved up 50.2 over the prior 243 months.
Below are key valuation metrics over time for CMT.
Stock | Date | P/S | P/B | P/E | EV/EBIT |
---|---|---|---|---|---|
CMT | 2021-09-03 | 0.4 | 1.1 | 11.6 | 7.3 |
CMT | 2021-09-02 | 0.4 | 1.2 | 11.9 | 7.4 |
CMT | 2021-09-01 | 0.4 | 1.2 | 11.9 | 7.4 |
CMT | 2021-08-31 | 0.4 | 1.1 | 11.7 | 7.3 |
CMT | 2021-08-30 | 0.4 | 1.2 | 11.7 | 7.3 |
CMT | 2021-08-27 | 0.4 | 1.2 | 11.9 | 7.4 |
CMT Growth Metrics
- Its 5 year net cashflow from operations growth rate is now at -21.16%.
- Its 5 year revenue growth rate is now at 41.61%.
- Its 2 year cash and equivalents growth rate is now at -44.93%.

The table below shows CMT's growth in key financial areas (numbers in millions of US dollars).
Date | Revenue | Operating Cash Flow | Net Income to Common Stock |
---|---|---|---|
2021-12-31 | 307.483 | 12.546 | 4.671 |
2021-09-30 | 294.966 | 2.16 | 3.363 |
2021-06-30 | 273.814 | 18.177 | 10.018 |
2021-03-31 | 231.159 | 22.273 | 3.66 |
2020-12-31 | 222.356 | 28.164 | 8.165 |
2020-09-30 | 217.824 | 43.78 | 3.57 |
CMT's Quality Factors
The “Quality” component of the POWR Ratings focuses on 31 different factors of a companies fundamentals and operational strength. Here are some key insights as we drill into the specifics of these quality attributes.- CMT has a Quality Grade of B, ranking ahead of 86.13% of graded US stocks.
- CMT's asset turnover comes in at 1.548 -- ranking 4th of 22 Rubber and Plastic Products stocks.
- CXDC, AWI, and FORD are the stocks whose asset turnover ratios are most correlated with CMT.
The table below shows CMT's key quality metrics over time.
Period | Asset Turnover | Gross Margin | ROIC |
---|---|---|---|
2021-06-30 | 1.548 | 0.173 | 0.148 |
2021-03-31 | 1.351 | 0.158 | 0.095 |
2020-12-31 | 1.309 | 0.155 | 0.089 |
2020-09-30 | 1.257 | 0.128 | 0.029 |
2020-06-30 | 1.303 | 0.101 | -0.049 |
2020-03-31 | 1.470 | 0.105 | -0.023 |
CMT Stock Price Chart Interactive Chart >
CMT Price/Volume Stats
Current price | $9.19 | 52-week high | $17.35 |
Prev. close | $9.32 | 52-week low | $7.96 |
Day low | $8.95 | Volume | 5,900 |
Day high | $9.31 | Avg. volume | 12,028 |
50-day MA | $9.95 | Dividend yield | N/A |
200-day MA | $9.85 | Market Cap | 79.93M |
Core Molding Technologies Inc (CMT) Company Bio
Core Molding Technologies, Inc. manufactures sheet molding compound (SMC) and molds fiberglass reinforced plastics. It specializes in large-format moldings and offers a range of fiberglass processes, including compression molding of SMC, glass mat thermoplastics, bulk molding compounds, and direct long-fiber thermoplastics; and spray-up, hand lay-up, and resin transfer molding. The company was founded in 1988 and is based in Columbus, Ohio.
Latest CMT News From Around the Web
Below are the latest news stories about Core Molding Technologies Inc that investors may wish to consider to help them evaluate CMT as an investment opportunity.
Core Molding Technologies Reports Q3 2021 ResultsCore Molding Technologies, Inc. (NYSE American: CMT) ("Core Molding", "Core" or the "Company") today announced results for the third quarter ended September 30, 2021. |
Core Molding Technologies Reports Q2 2021 ResultsCore Molding Technologies, Inc. (NYSE American: CMT) ("Core Molding", "Core" or the "Company") today announced results for the second quarter ended June 30, 2021. |
Core Molding Technologies, Inc. (CMT) Fell Out Of Favor With Hedge FundsHedge Funds and other institutional investors have just completed filing their 13Fs with the Securities and Exchange Commission, revealing their equity portfolios as of the end of September. At Insider Monkey, we follow nearly 900 active hedge funds and notable investors and by analyzing their 13F filings, we can determine the stocks that they are […] |
Core Molding Technologies Reports Strong Q1 2021 ResultsCore Molding Technologies, Inc. (NYSE American: CMT) ("Core Molding", "Core" or the "Company") today announced results for the first quarter ended March 31, 2021. |
Core Molding Technologies' (NYSEMKT:CMT) Wonderful 935% Share Price Increase Shows How Capitalism Can Build WealthWhile stock picking isn't easy, for those willing to persist and learn, it is possible to buy shares in great... |
CMT Price Returns
1-mo | -7.36% |
3-mo | -14.51% |
6-mo | 7.99% |
1-year | -46.10% |
3-year | 25.89% |
5-year | -57.10% |
YTD | 7.99% |
2021 | -39.56% |
2020 | 333.23% |
2019 | -54.29% |
2018 | -67.03% |
2017 | 27.13% |
Continue Researching CMT
Want to do more research on Core Molding Technologies Inc's stock and its price? Try the links below:Core Molding Technologies Inc (CMT) Stock Price | Nasdaq
Core Molding Technologies Inc (CMT) Stock Quote, History and News - Yahoo Finance
Core Molding Technologies Inc (CMT) Stock Price and Basic Information | MarketWatch
Loading social stream, please wait...